
SESResultsViewer
Integrated Graphics and Report Output Processor
A software utility for viewing, filtering and examining computation results in the form of plots and reports for the intended SES Software package computation modules, i.e., RESAP, MALT, MALZ, HIFREQ, SPLITS and FCDIST.
Data Selection Panel
The Data Selection panel is essentially the control center of SESResultsViewer, and features multiple options for determining the types of plots and reports to generate, and for customizing the appearance of plotted data. Multiple plotting thresholds and options for plot rendering and filtering are available for refining the display of configuration and computation results.
Configuration Plotting
CDEGS computation modules generate a wealth of useful information about a system, including data related to Leakage Currents, GPR, Longitudinal Currents, Coating Stress Voltages, Ground Potential Differences, and more. From the Configuration section of the Data Selection panel in SESResultsViewer, users can select specific results to plot, as well as settings for specifying how the results should be displayed; these include color coding settings and options for specifying the appearance of the textual labelling of numerical results.
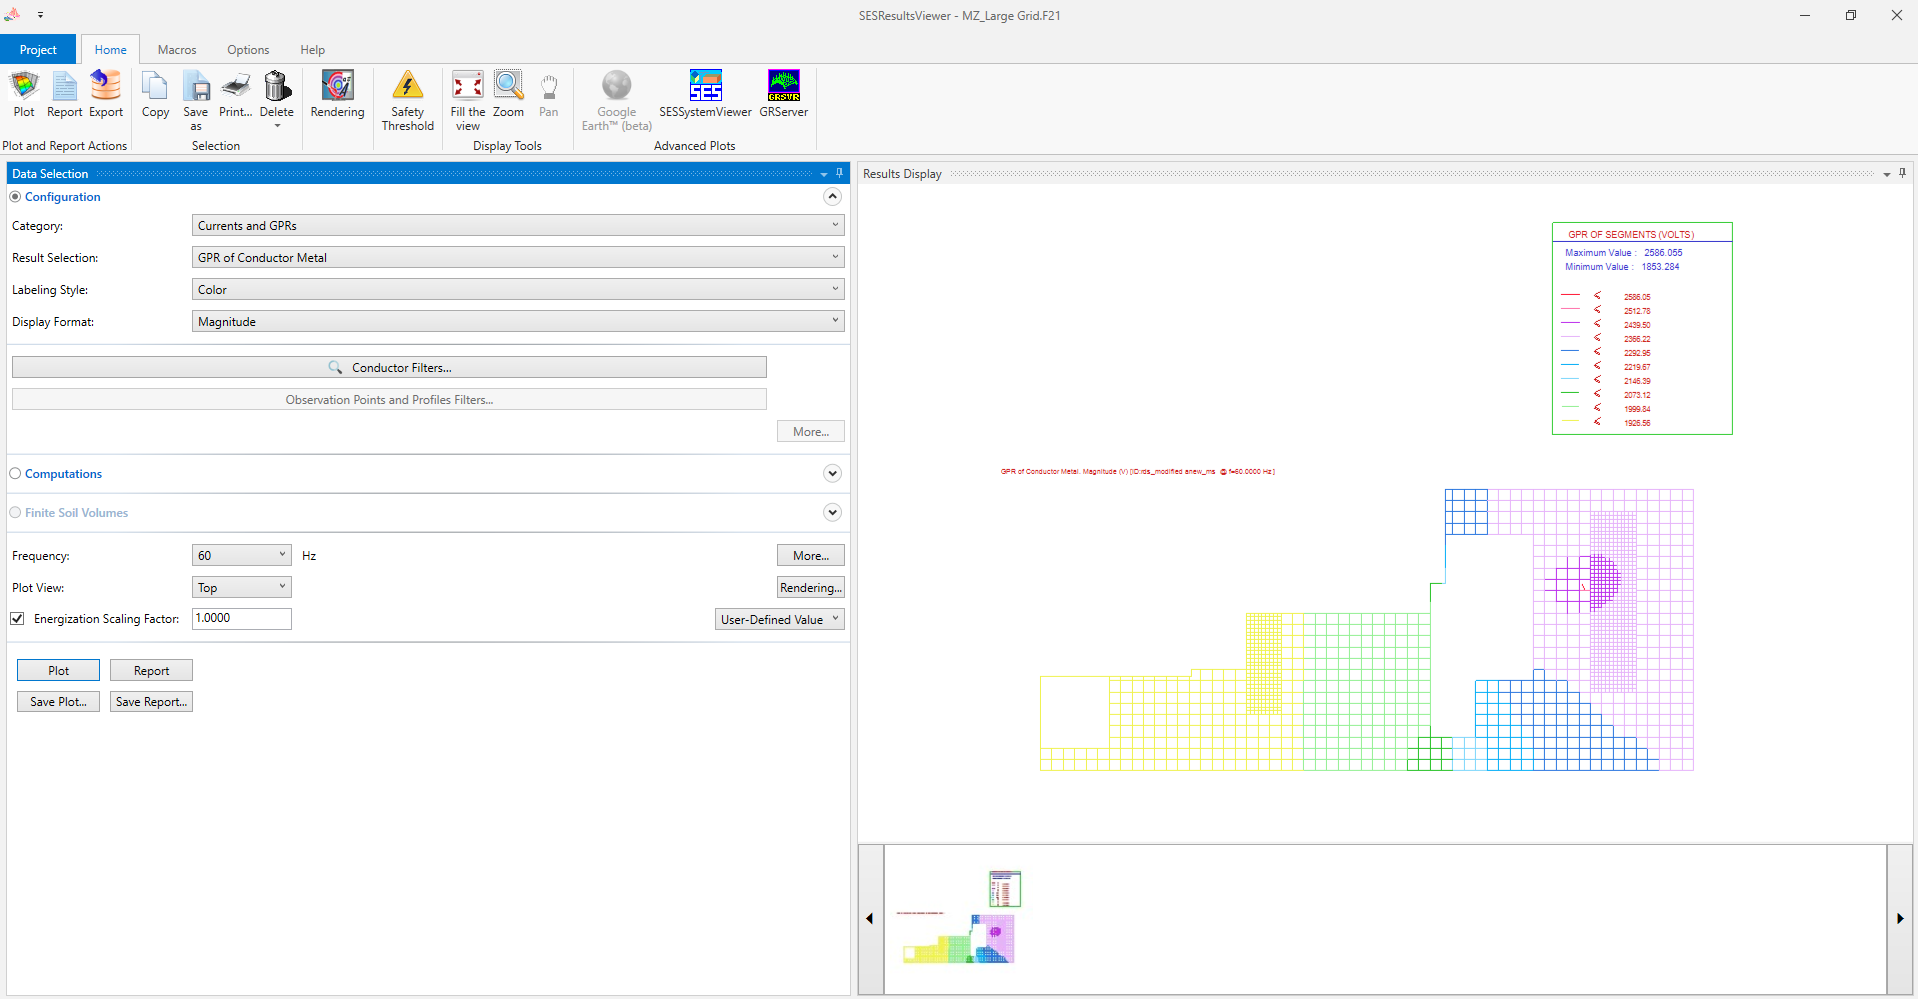
SESResultsViewer main screen. Configuration plot of a system’s ground potential rise is displayed in the Results Display panel at right.
Conductor Filtering
In order to facilitate the inspection and analysis of a subsection or particular component of a complex system, users can apply filters to the conductors that are plotted. Filters can be based on multiple criteria including: conductor depth, radius, length, coating characteristics, or essentially any characteristic specified in the conductor type definitions of the system model.
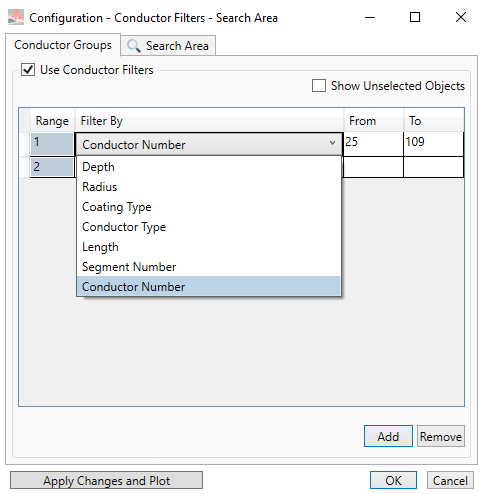
Specifying conductor filters.
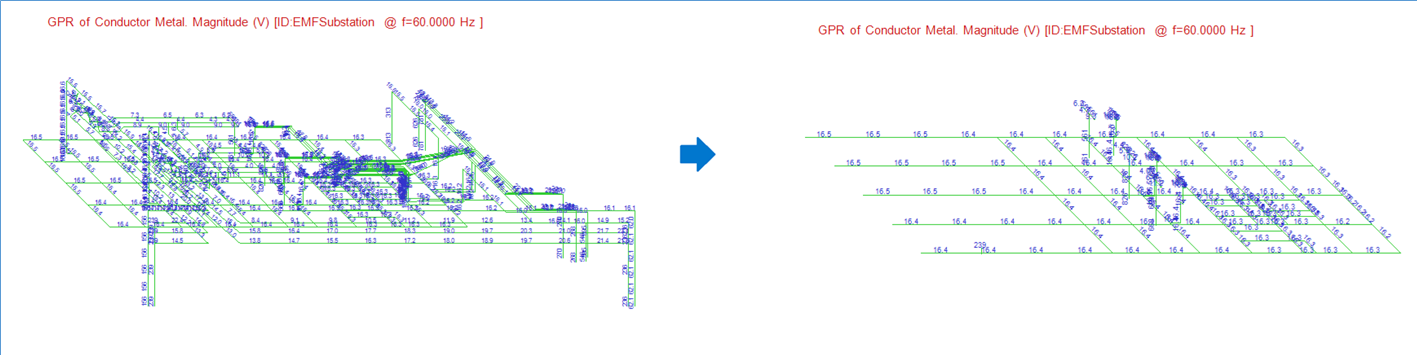
Configuration plots: before and after selection of conductor filters.
Zooming and Rendering
A zoom feature enables the graphical selection of a region of a system to be plotted, and the appearance of a plot can be customized in a Display Options screen, where each data interval comprising the full range of computed output values can be assigned a specific color which is determined by the user.
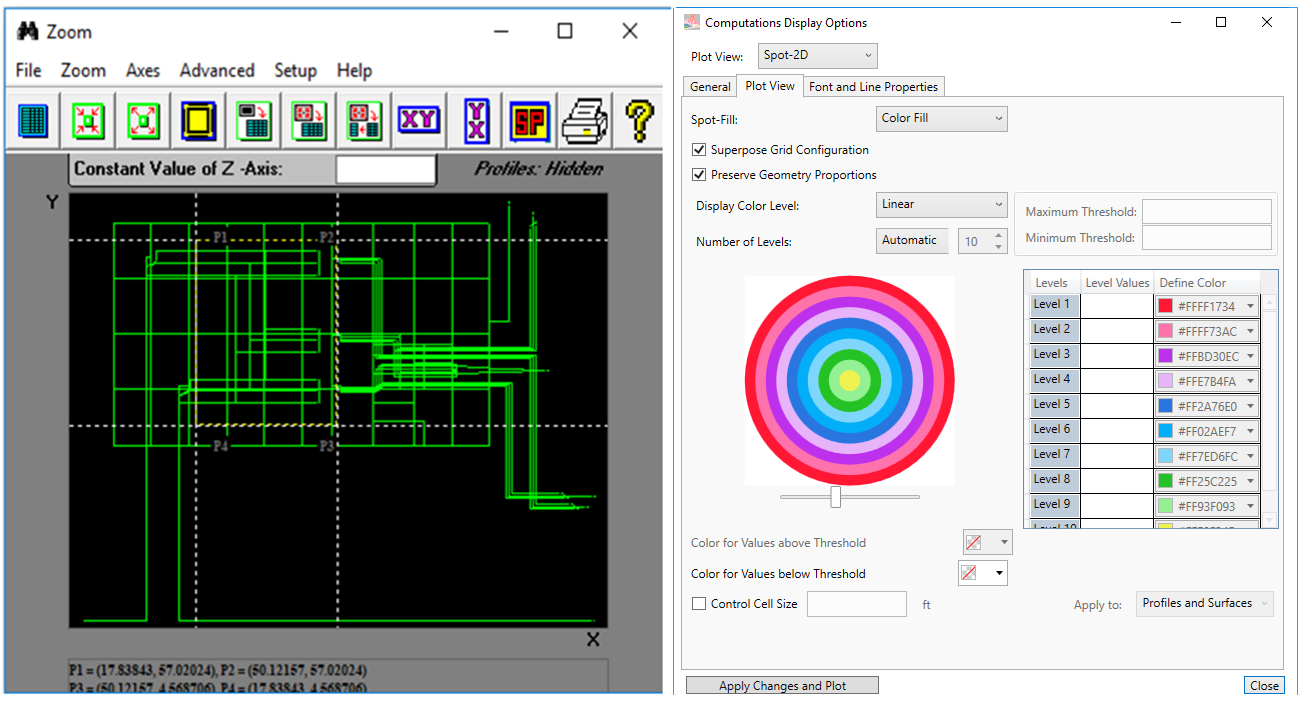
Zoom feature and Computations Display Options screen.
Home Ribbon
Other useful features of SESResultsViewer are accessed via the Home ribbon:
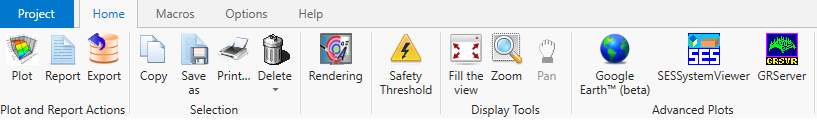
Home ribbon.
From here, users can export data in a comma-separated values (.csv) format, record and play macros, print and generate reports, and more. The Advanced Plots portion of the ribbon includes options for creating plots with SESSytemViewer and GRServer, as well as an option for exporting horizontal profiles in a Google Earth™ (.kml) file format:
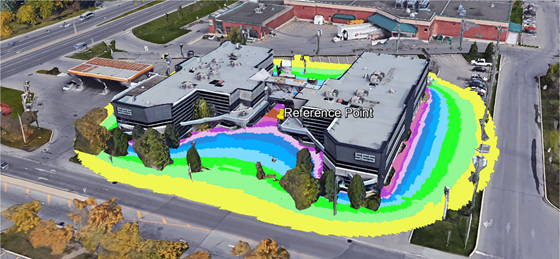
Computation data exported in .kml format to Google EarthTM
Results Display Panel
For every plot that is displayed, a thumbnail image of that plot will appear in a summary section located below the Results Display panel. These thumbnails are used as references to individual plot windows; clicking on a thumbnail highlights the corresponding plot window.
Computations Plotting
The Computations section of the Data Selection panel features a variety of options related to the plotting and reporting of results computed at specified observation points. These include touch and step voltages, soil potentials, conductor data, and more.
Safety Threshold
While plotting touch and step voltages, the SESThreshold module, which is integrated into SESResultsViewer, can be used to compute safety thresholds for multiple zones. An overview of the multifaceted SESThreshold tool is available on the related page of our website.
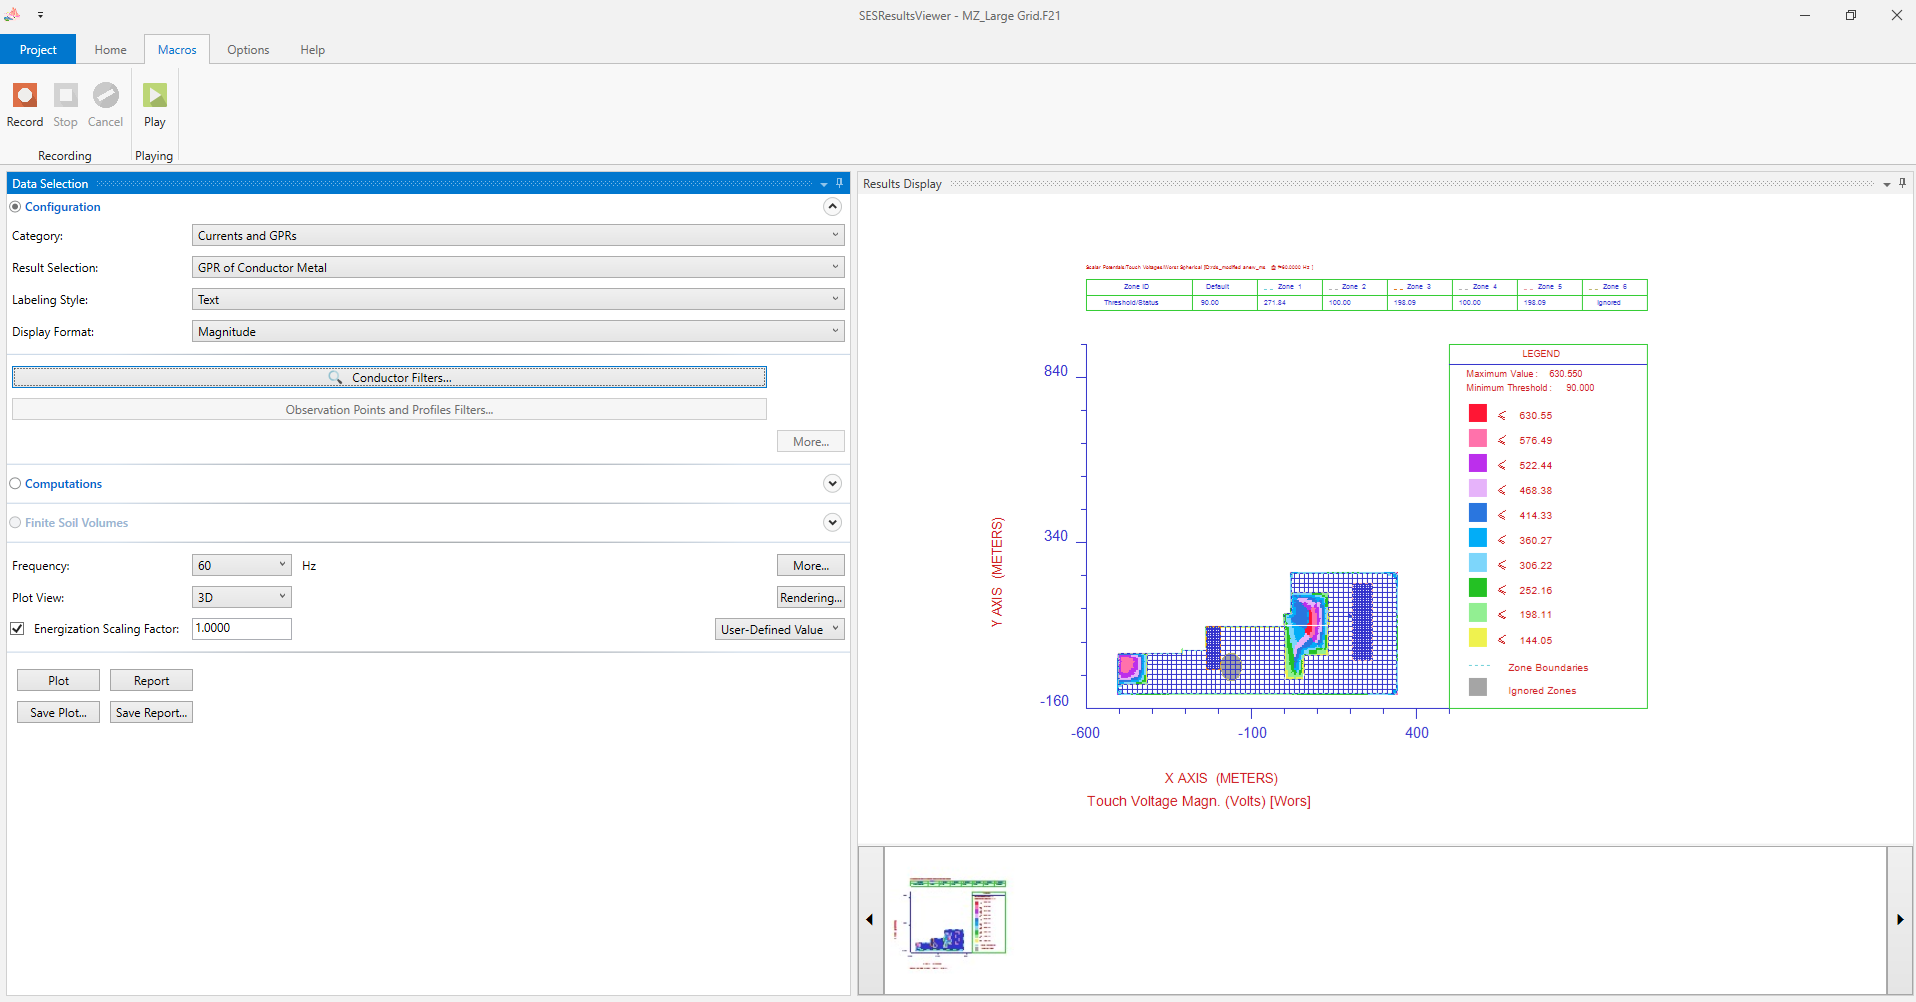
Computations plot depicting touch voltages at specified observation points.
SESResultsViewer’s reliable and rapid background processes ensure its smooth and efficient performance. Multiple instances of SESResultsViewer can be open at the same time, facilitating comparisons of the multiple types of reports and plots that can be generated with this powerful software tool.