SESPlotViewer | A Versatile Plotting Solution


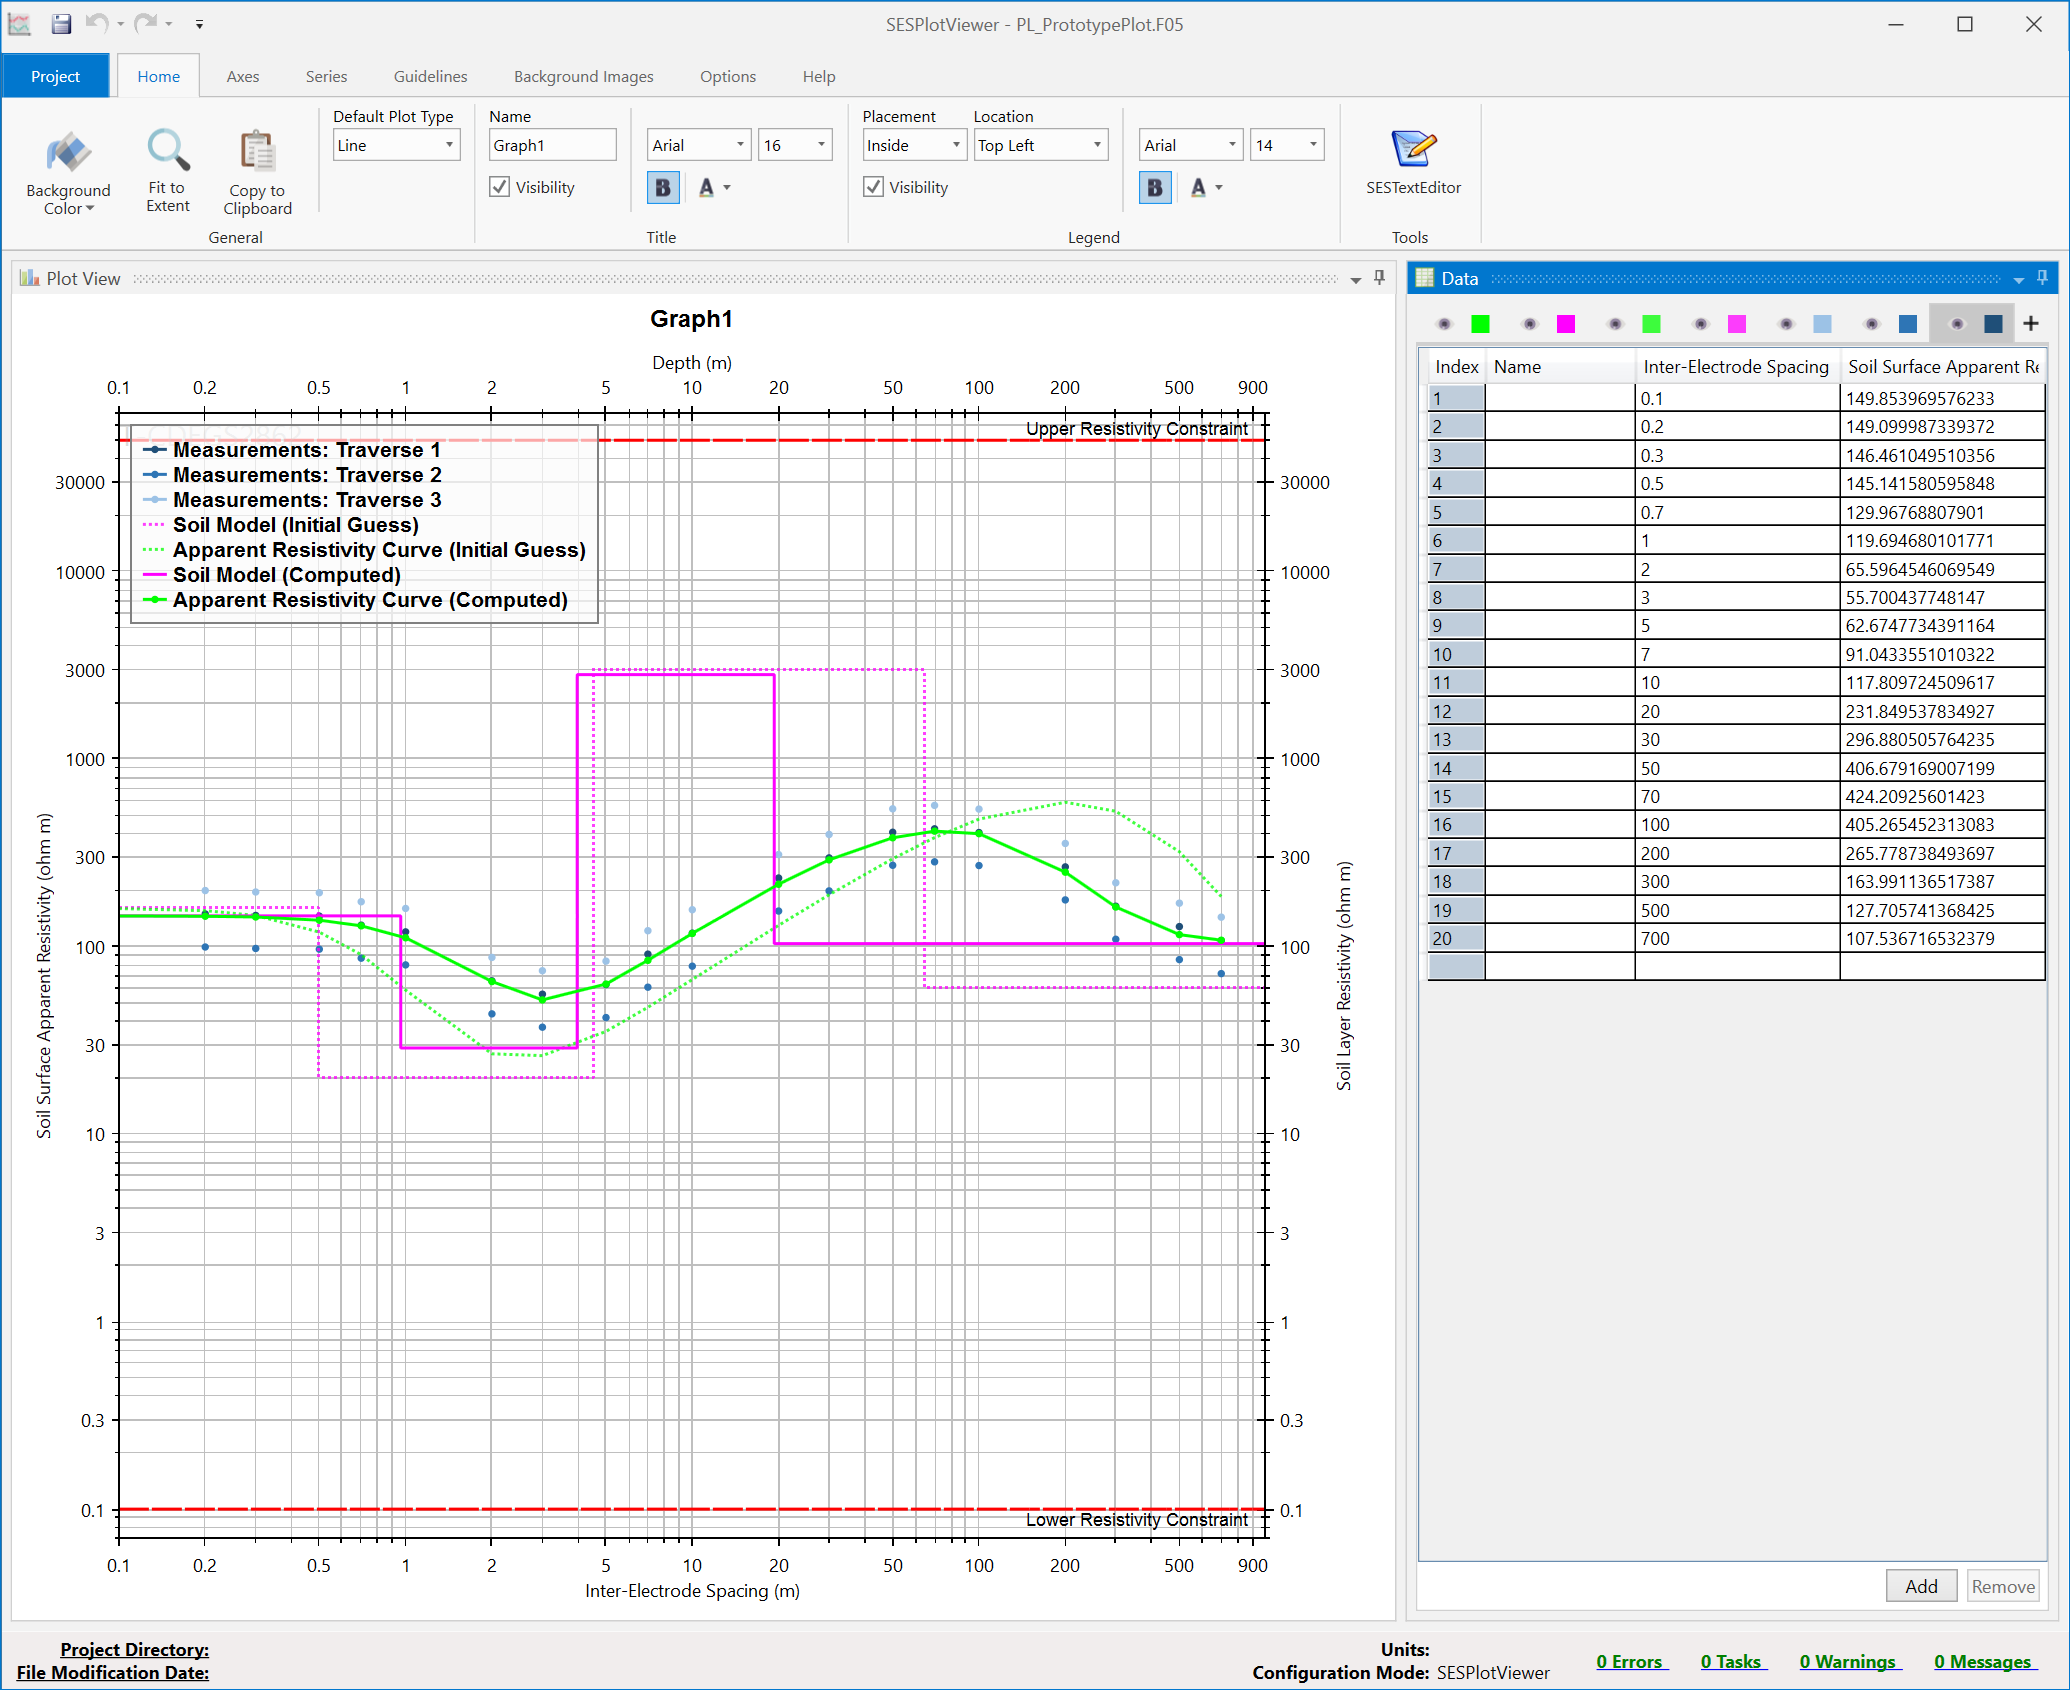
SESPlotViewer is a versatile plotting tool, which is integrated in other applications to create plots. It can also be used in a standalone mode to allow creating, customizing and modifying the graphs according to the preferences of the users. This tool enables several types of 2D and heatmap plots. It uses the standard F05 file approach to create, store and open plot files.


Technical Description

SESPlotViewer generates easily customizable plots that can be created automatically by other applications or using data, either imported from CSV files or entered manually in the interface. The main window allows selecting the plot types to be generated. Two main plot categories can be created:

  • 2D Line Plot: used to display a series of data as a continuous 2D line, a series of unconnected data points, or to act as a stair step 2D graph.
  • Heatmap Plot: this option can be used to display a series of data as a 2D surface plot, applying color levels to indicate the magnitude of the quantities being plotted.


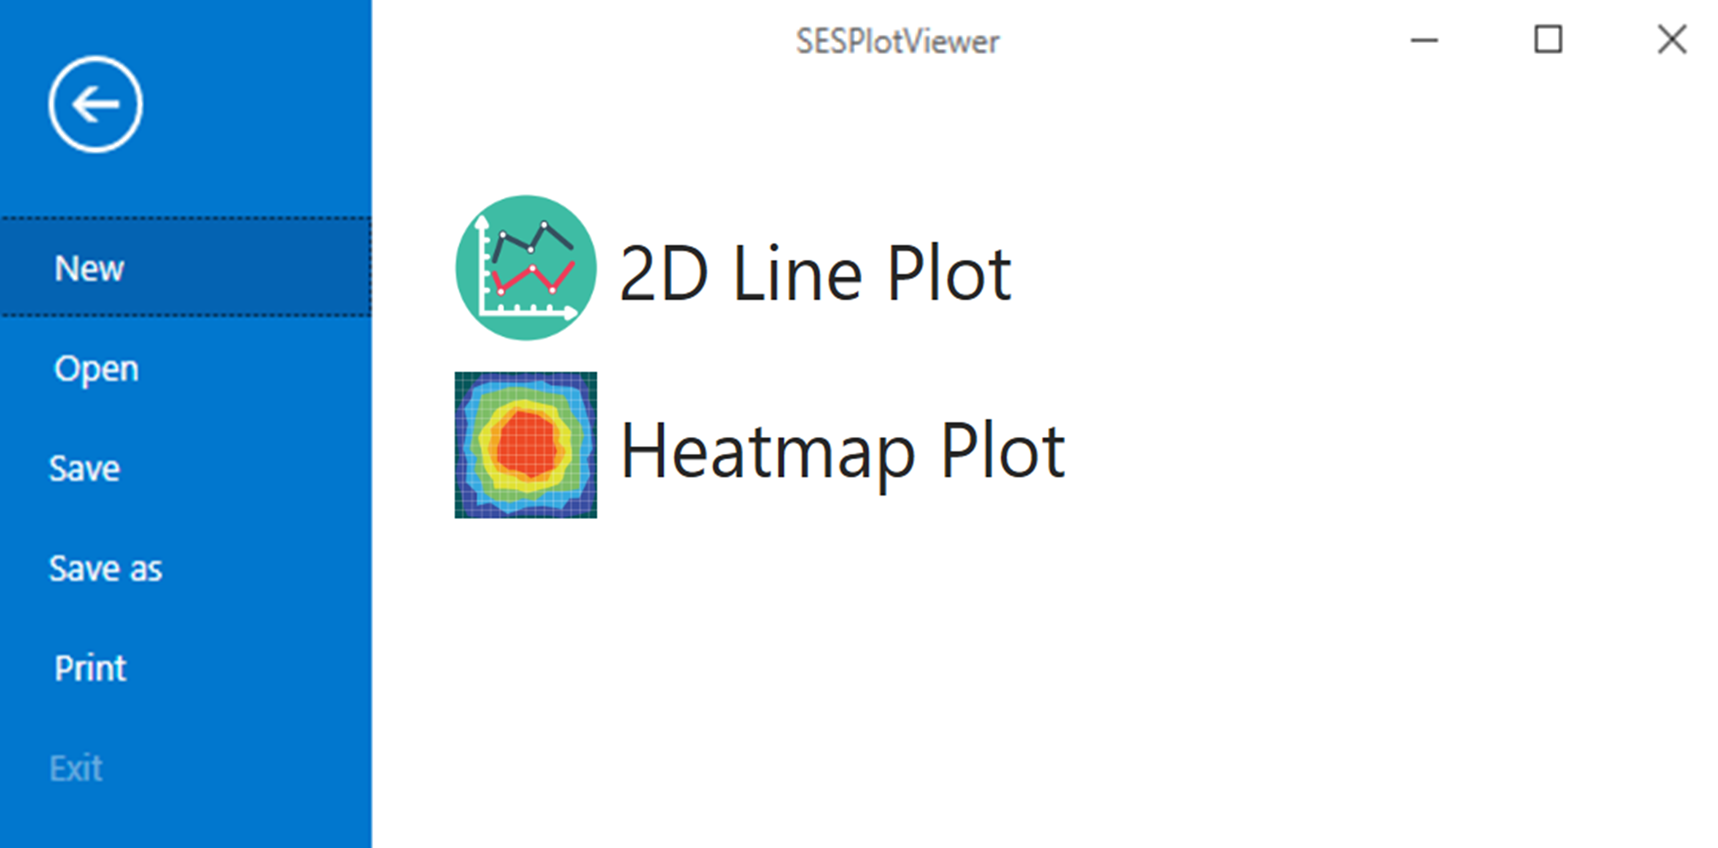
Plots of SESPlotViewer


Technical Features

  • An arbitrary number of series of data can be plotted on the same graph.
  • Each series can be plotted with personalized characteristics, plotting and line style.
  • Several axes, with different types, can be used to plot data of various electrical properties.
  • Different backgrounds can be optionally selected.
  • Legends can be specified at different locations.
  • Guidelines can be created with different line styles and positions.
  • Data can be imported from CSV files and plotted.