RowCAD and Right-of-Way Pro
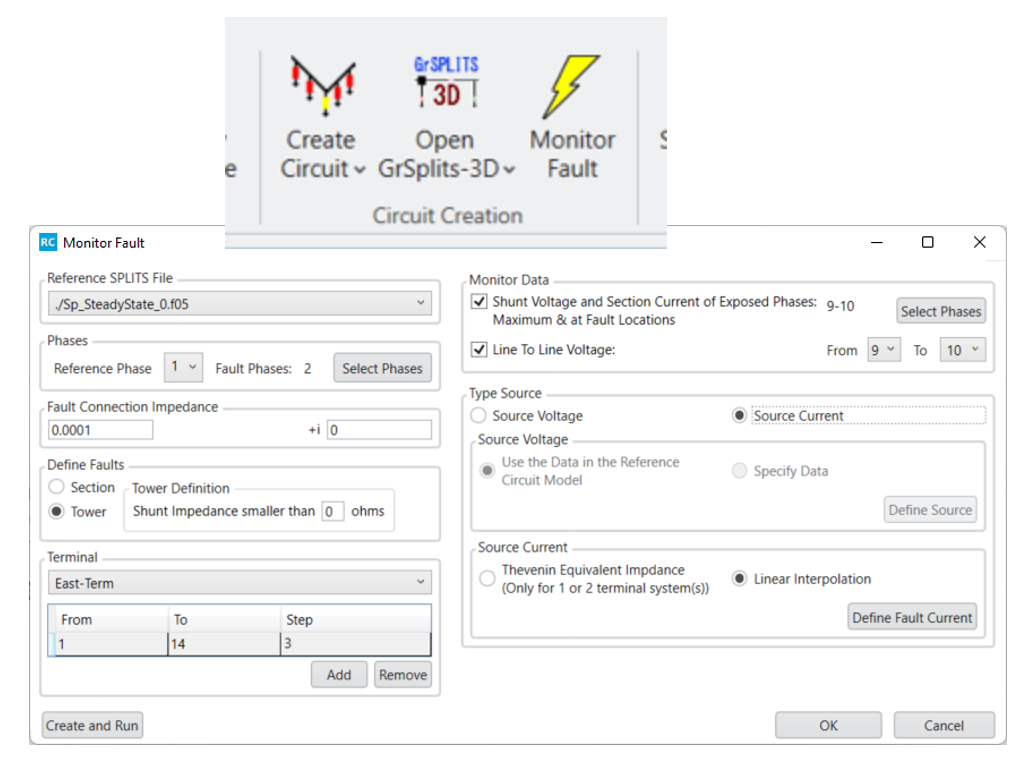
The latest version of the Right-of-Way software package (ROW) fully supports all Monitor Fault computations defined in RowCAD.
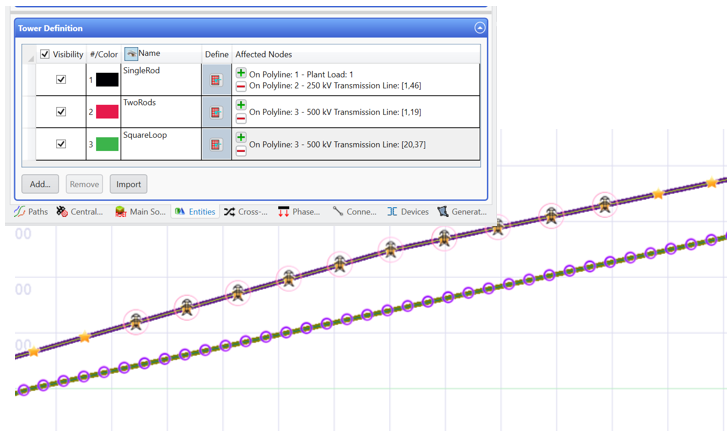
The latest version of ROW supports any user-defined customized tower footing configurations.
RowCAD gained useful display and editing features: a new polyline simplification tool, the ability to import transformers and tower models from other scenarios, user-defined entity outlines in the viewer, the ability to access polyline cross-sections directly from the viewer, and a TRASPL computation progress meter.
Since the MALZ computation engine now supports Multi-Region Soils, a new Multi-Region Soil Model option has been introduced in the Total Interference MALZ model.
The Plot & Report module can now report the Line-to-Line Voltage for both Inductive (SPLITS) and Total Interference on a single run or the envelopes from multiple runs for Steady State and Fault Conditions.
An option was introduced in this new version of ROW that allows you to hide some data to simplify the file. As a result, the size of the generated SPLITS files can be reduced by selecting the appropriate option.
ROW now fully supports multiple grounds at the Central Site for both inductive (SPLITS) models and Total Interference (MALZ) models, ROW now keeps all group information for objects defined as RowCAD Entities or in the Total Interference template file, and some intermediate computation folders were reorganized. In particular, the internal computation files are stored under ".\Workspace\".
ROW can now automatically count the Maximum No. of Points within a Region when importing the project data from RowCAD, and then use this number to dynamically dimension a few large arrays used in ROW computations. Consequently, computer resources are managed more efficiently, reducing the possibilities of "Out-of-Memory" situations, during the computation process.
Consult the article “New Features in RowCAD & ROW” for more details.
CorrCAD and SESCPCalculator
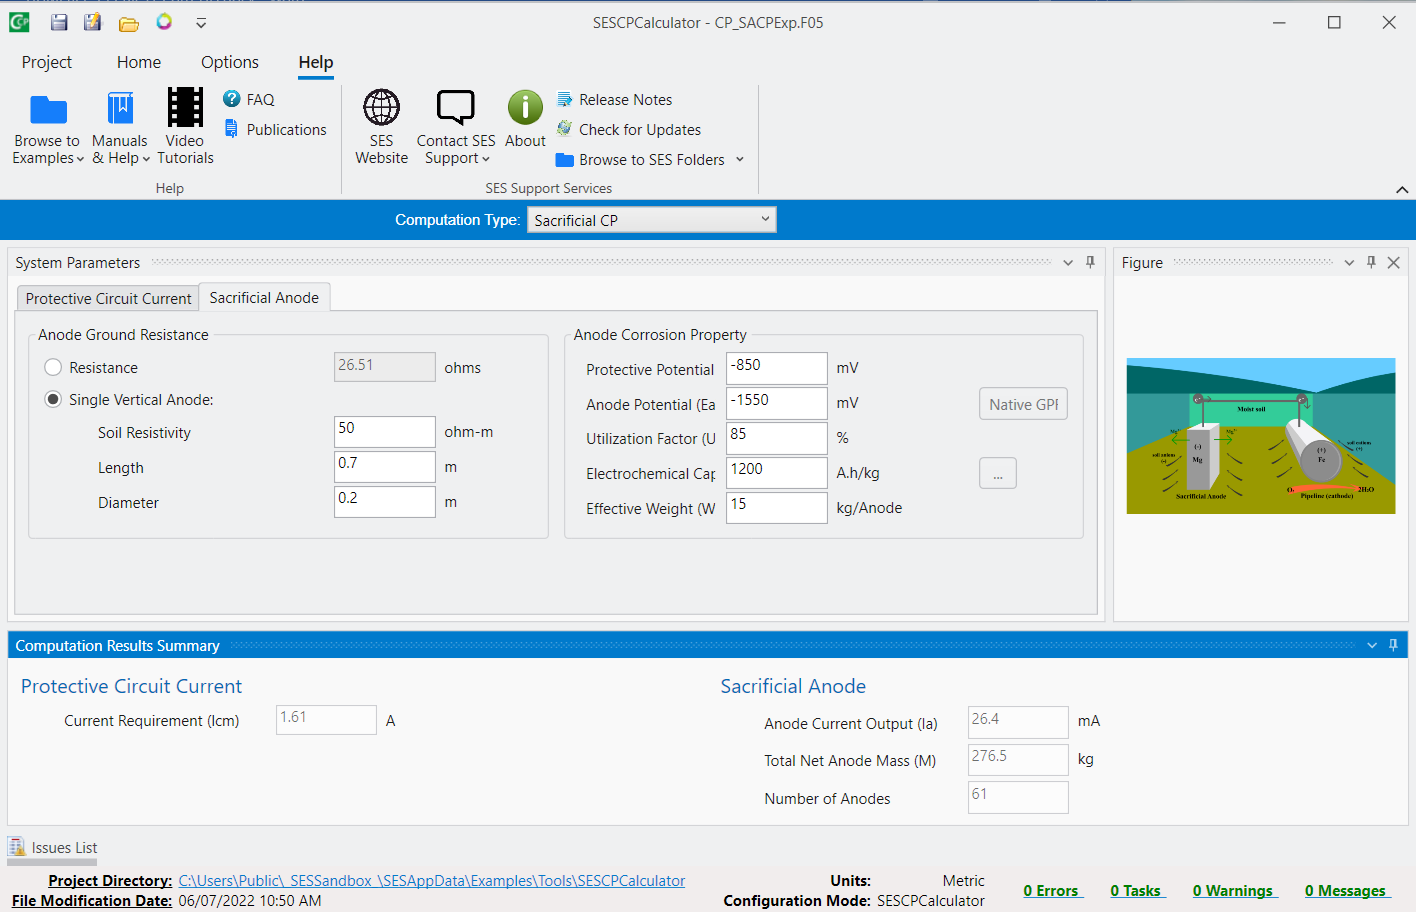
SESCPCalculator is a new tool that quickly performs calculations to estimate appropriate cathodic protection design for specific target structures to be protected against corrosion. It automatically analyzes the system to be protected and provides a design for a cathodic protection system in accordance with various standards (e.g., NACE SP0169, NACE SP0177, DNV-RP-B401 & DNV-RP-F103). SESCPCalculator provides estimate of CP requirments for both ICCP (Impressed Current Corrosion Protection and GACP (SACP) (Galvanic/Sacrificial Anode Corrosion Protection), respectively, onshore and offshore.
Figure 18
The new version of CorrCAD now sets the energization method to Use Energization independently only. The energizations are applied independently in both the HIFREQ and MALZ Computation Module types. In MALZ mode, if an energization is assigned to multiple locations, CorrCAD will duplicate that energization and assign each instance to a single location. This is done when a MALZ computation model F05 file is produced.
This year, Multi-Region Soil Model is introduced in CorrCAD MALZ mode. It eliminates the limitation of only being able to apply a single soil model to the entire network. CorrCAD can now be used for studies with multiple, multilayer soil environments with both MALZ and HIFREQ modes. This capability is important, especially when conductor networks reach a certain size.
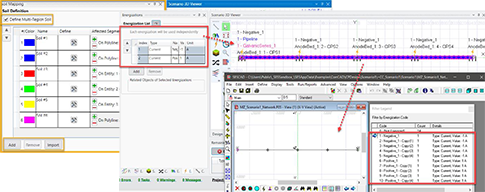
Figure 19
Consult the article “Advances in Corrosion Design and Analysis” for more details.
SESShield-2D
SESShield-2D is a CDEGS sub-package used to analyze the shielding performance of transmission lines and to assess the risks caused by lightning strikes to facilities. A new interface was first introduced at the on-line 2021 Users’ Group Conference.
This year’s version of SESShield-2D includes the following enhancements:
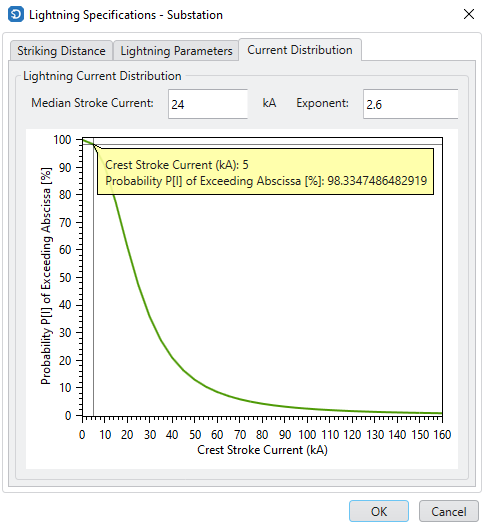
- In the lightning specifications, under the Current Distribution tab, a probability plot has been included. It graphs the cumulative probability, expressed as a percentage, that the peak current (in kA) of the first negative return stroke will exceed the value shown by the x-axis of the graph. The median stroke current, often taken to be 31 kA for strokes to overhead ground wires, conductors and structures (Anderson [B7]), can be changed to 24 kA, the value proposed by (Mousa [B109]) for strokes to flat ground, or to any other value, for that matter.
Also, when clicking on any point slightly above the x-axis and dragging the mouse pointer horizontally, each crest stroke current and associated cumulative probability percentage will be displayed. The default values of median stroke current IMedian=31 kA and Exponent α =2.6 are from IEEE Standard 1243-1997.
Figure 20: Cumulative probability function showing the probability
to have a strike with a peak current exceeding the x-axis value.
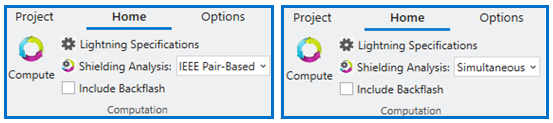
In the Transmission Line module (i.e., “Project Type”), the shielding analysis can now be changed easily from the Home tab. Beside de Compute button, the user can now choose to use either the IEEE Pair-Based or the Simultaneous method for the calculations (see the 2014 UGM article entitled “New Simultaneous Analysis for the Calculation of the Shielding Failure Rate of a Transmission Line and Other Improvements in SES-Shield” for more information about this latter method).
Figure 21: Selection of a transmission line analysis. Both methods are offered.
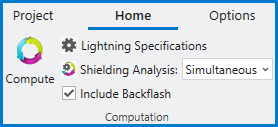
- The new SESShield-2D interface can now selectively include or exclude the backflash analysis. This option is located next to the Compute button and can be used with both methods (Simultaneous or IEEE Pair-Based) and is available when there is at least one shield wire present.
The results of the analysis can be found in the output file F09 after the computation is done.
Figure 22: Backflash analysis option selected in the ribbon.
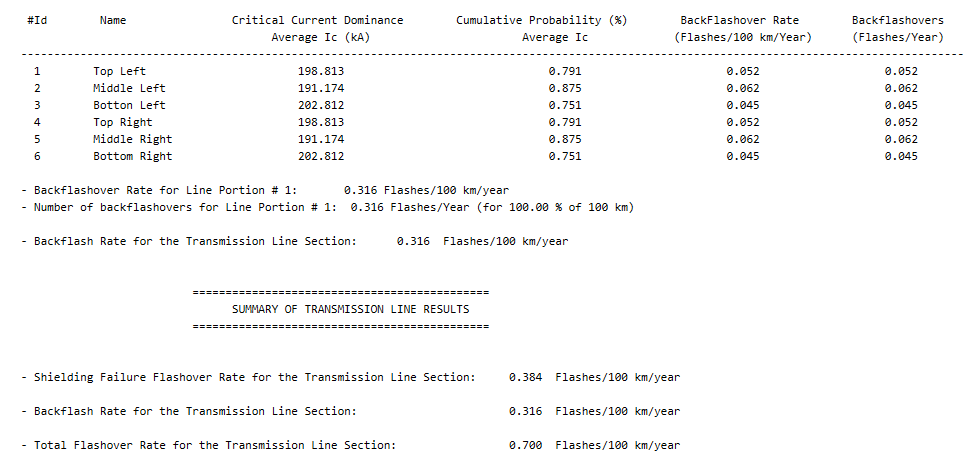
Figure 23: Example of backflash results after computations.
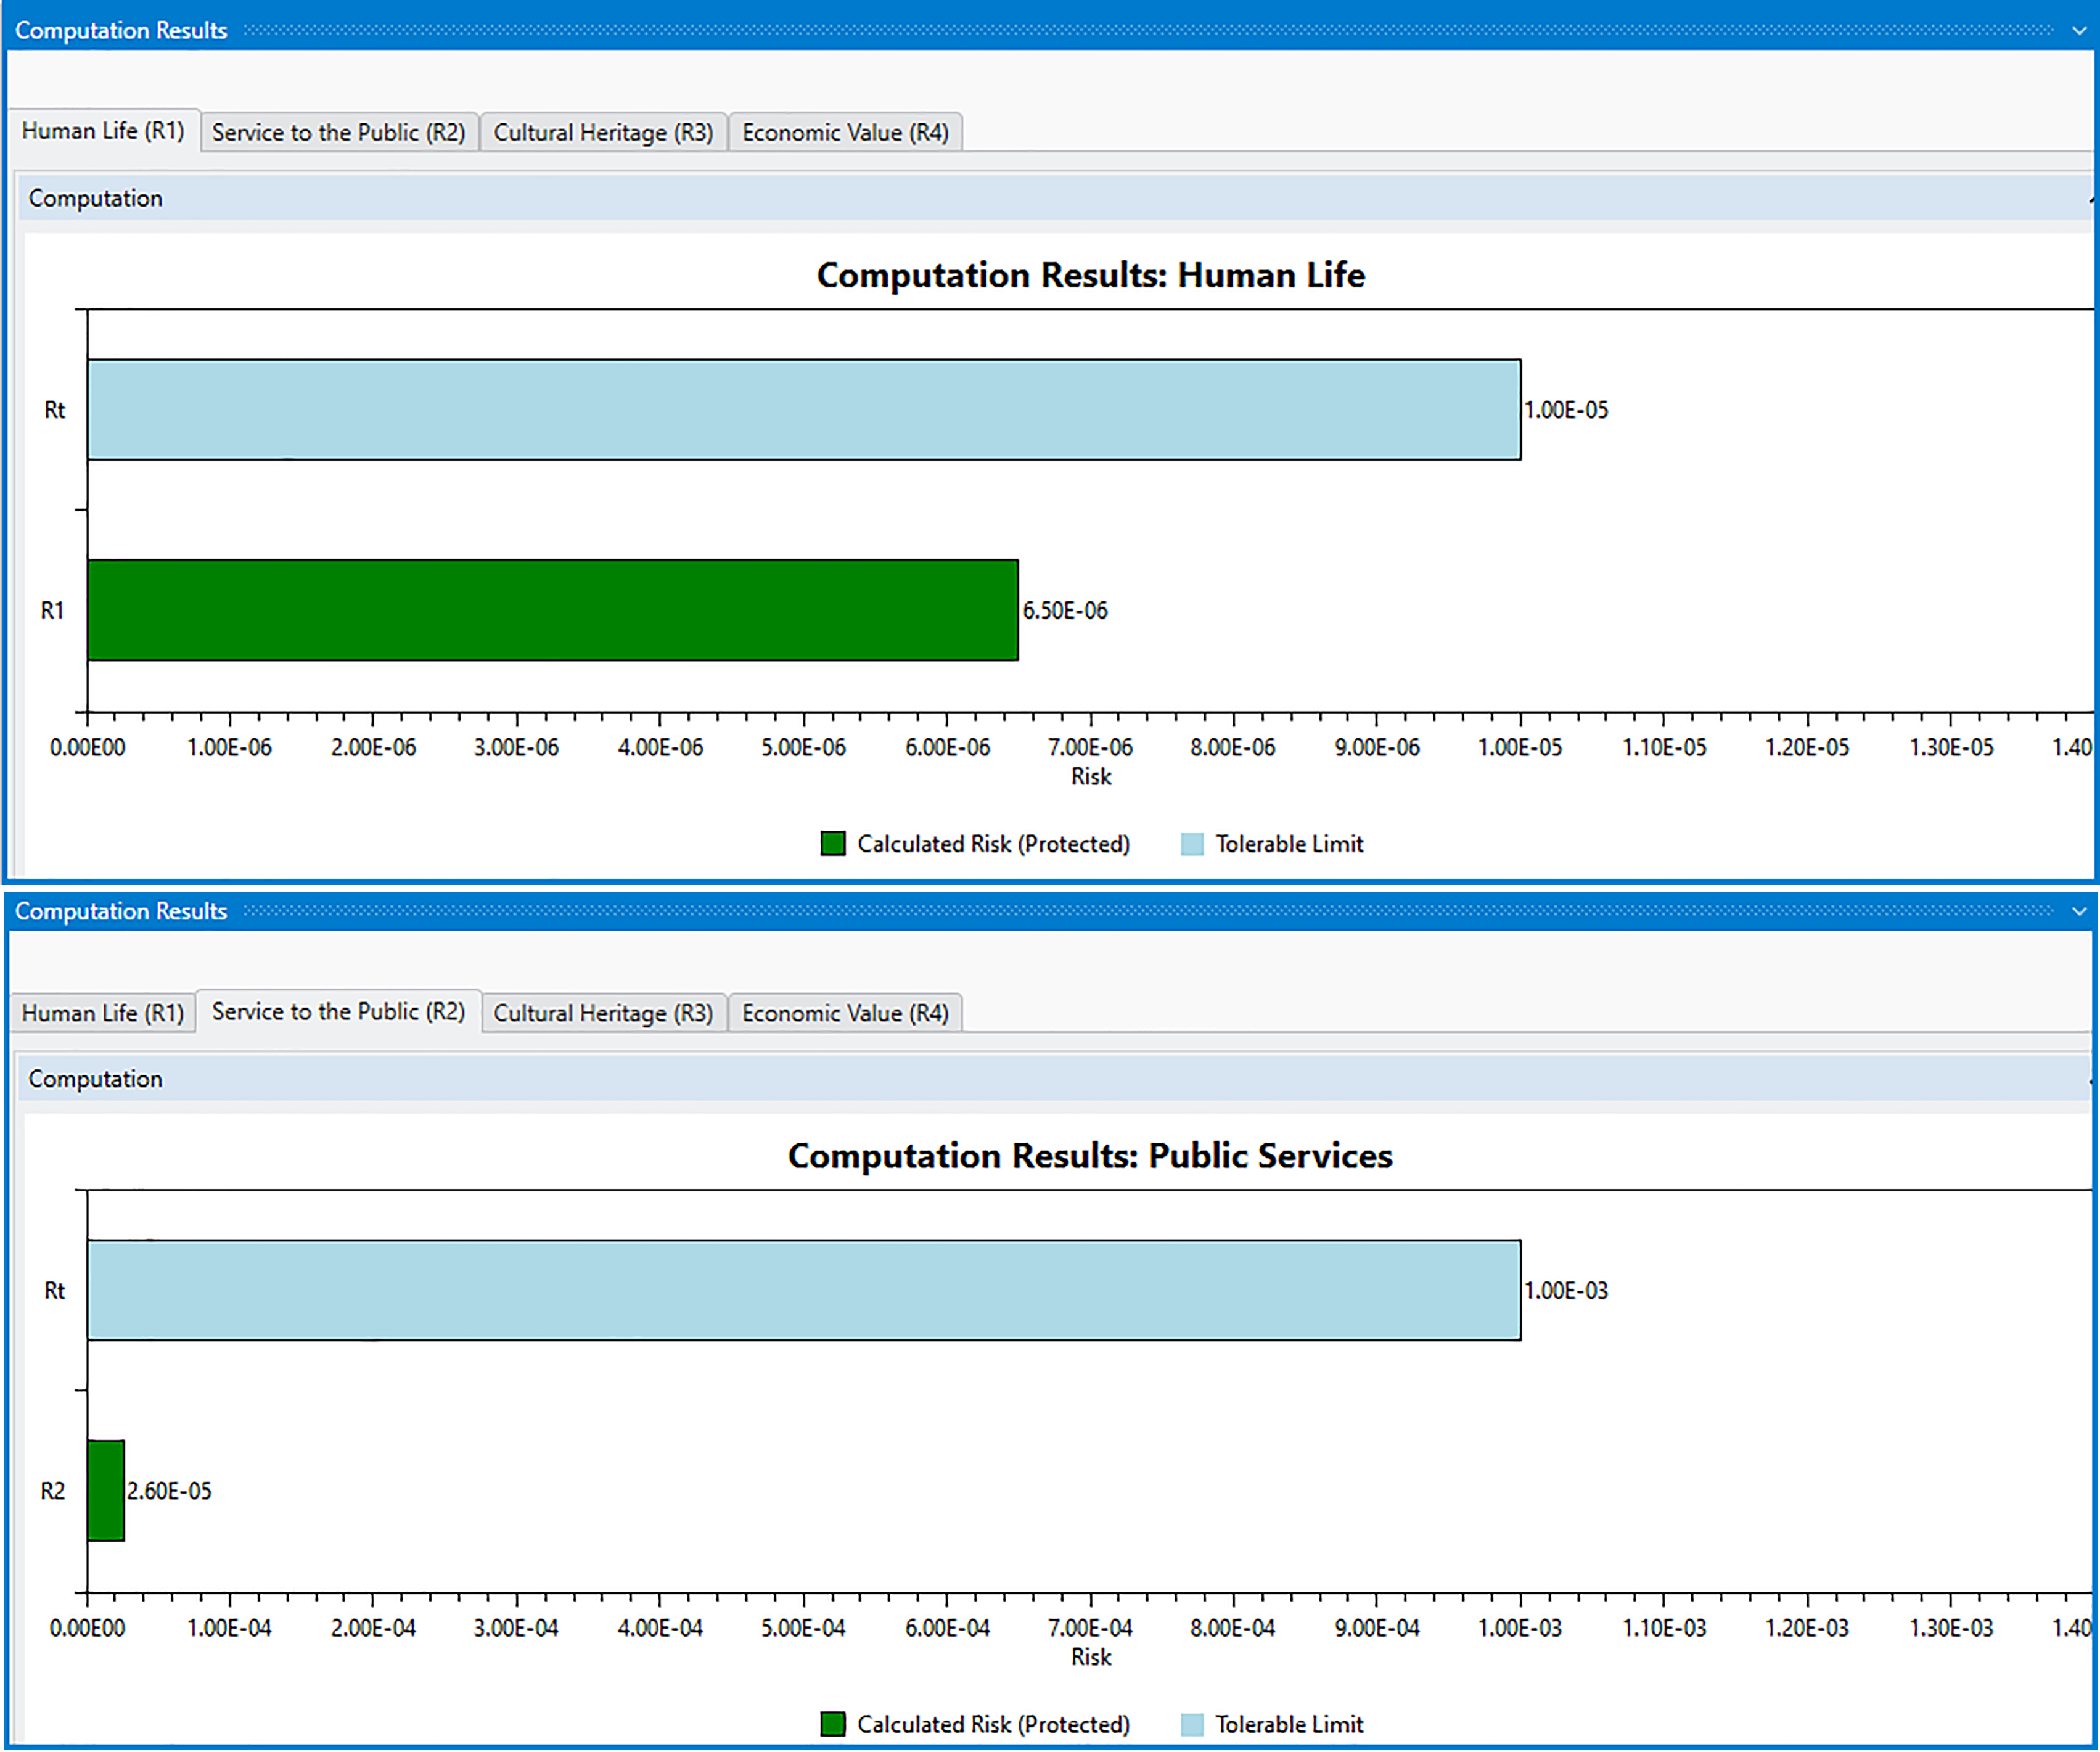
In the Risk Assessment module (i.e., “Project Type”), the computation results provide a tab for every type of loss selected. For a better visualization, the computed values and tolerable limits are now plotted to the same scale.
Figure 24: Computation result histograms for an office building example.
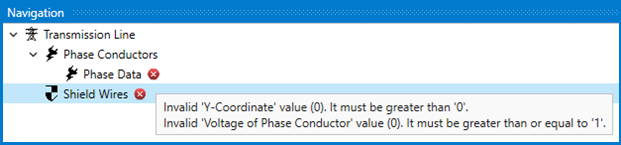
A new feature has been included in SESShield-2D for easier error tracking. Now, when there is an error (invalid input data, missing object, etc.), a red icon will show up in the tree view beside the issue object. When you position the pointer over the error icon, a tool tip with the error details is shown:
Figure 25: Transmission line tree view showing an error sign beside every object with issues.
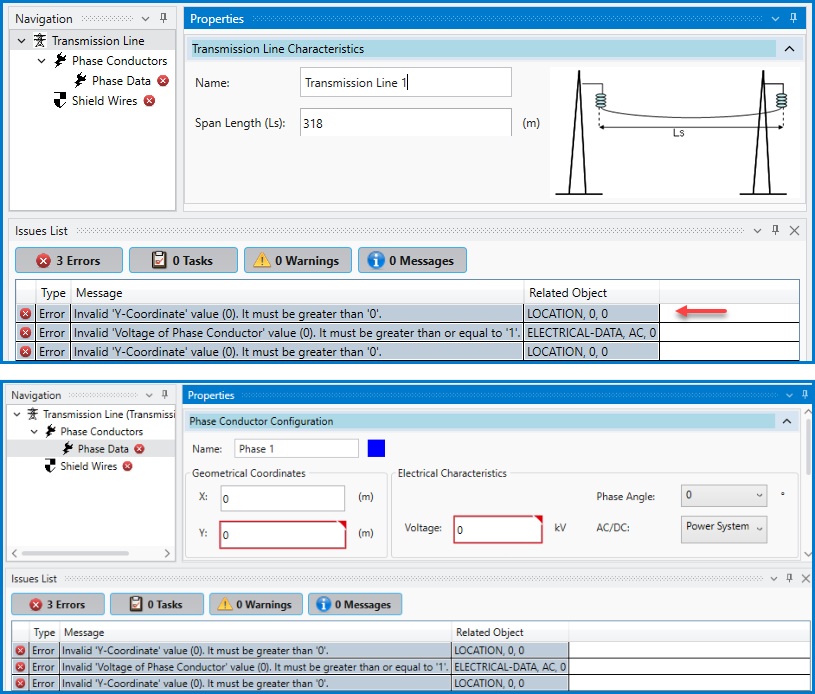
Also, you can now double-click an error in the issues list to go directly to the panel containing the issue that needs to be fixed:
Figure 26: Double-click on the first error from the Issues List
to see the panel where the correction is required.
SESTransient
SESTransient now automatically accounts for the presence of the lightning channel when
computing the transient response of a network struck by lightning. Also, the calculation of step
voltages is now carried out directly in the time-domain. Last but not least, the tool now runs as a
64-bit process, allowing larger cases to run without problems due to memory limitations.
Consult the article “Improvements in SESTransient” for more details.
SESTrainSimulator
This past year saw intensive development focused on facilitating the model creation, improving the module computation algorithms, enhancing its results producing capabilities and generalizing the algorithms to make them applicable to most electric train configurations and traction systems.
Creation of the base railway model is now done in an instant by combining a kml or kmz file representing the railway traces with a SESCrossSection file. The model can then be completed in SESCAD to add transformers, traction system energization and grounding grids. Moreover, SESTrainSimulator can now accommodate as many railway routes as needed to analyze a whole railway network in a single model.
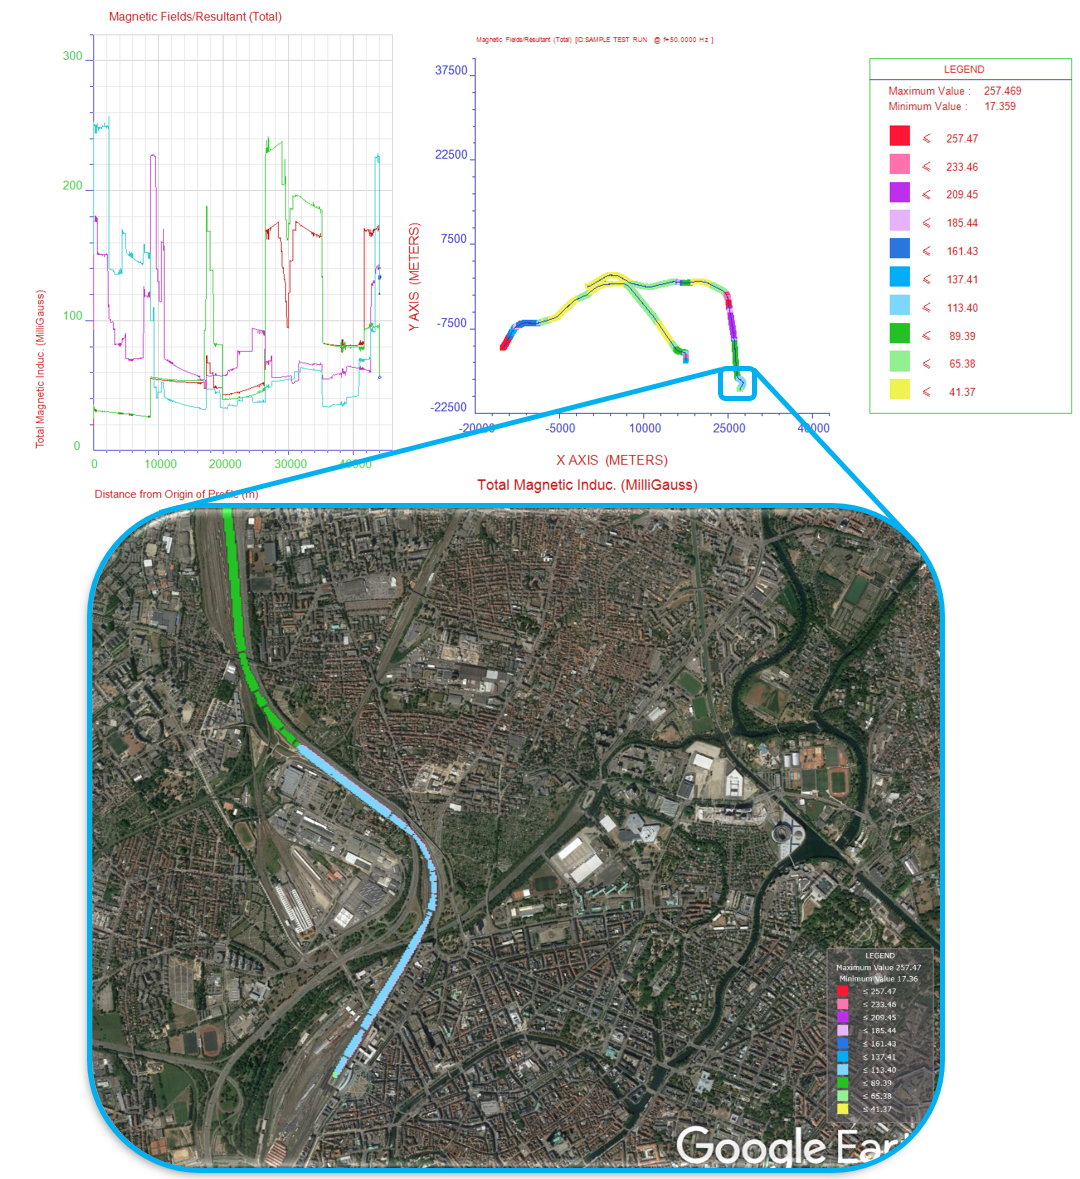
Figure 27: Different plot formats for the RMS magnetic field over the simulated time period
(2D, Spot 2D and Google Earth™).
Once computations are completed, SESCombiner is invoked to combine the results from multiple files into single Average, Minimum, Maximum and RMS results files, which can be used as any other results file in SESResultsViewer to obtain the electric and magnetic field envelopes. It offers the same plot producing flexibility.
Consult the article “Features and Improvements in SESTrainSimulator” for more details.
|