SESResultsViewer
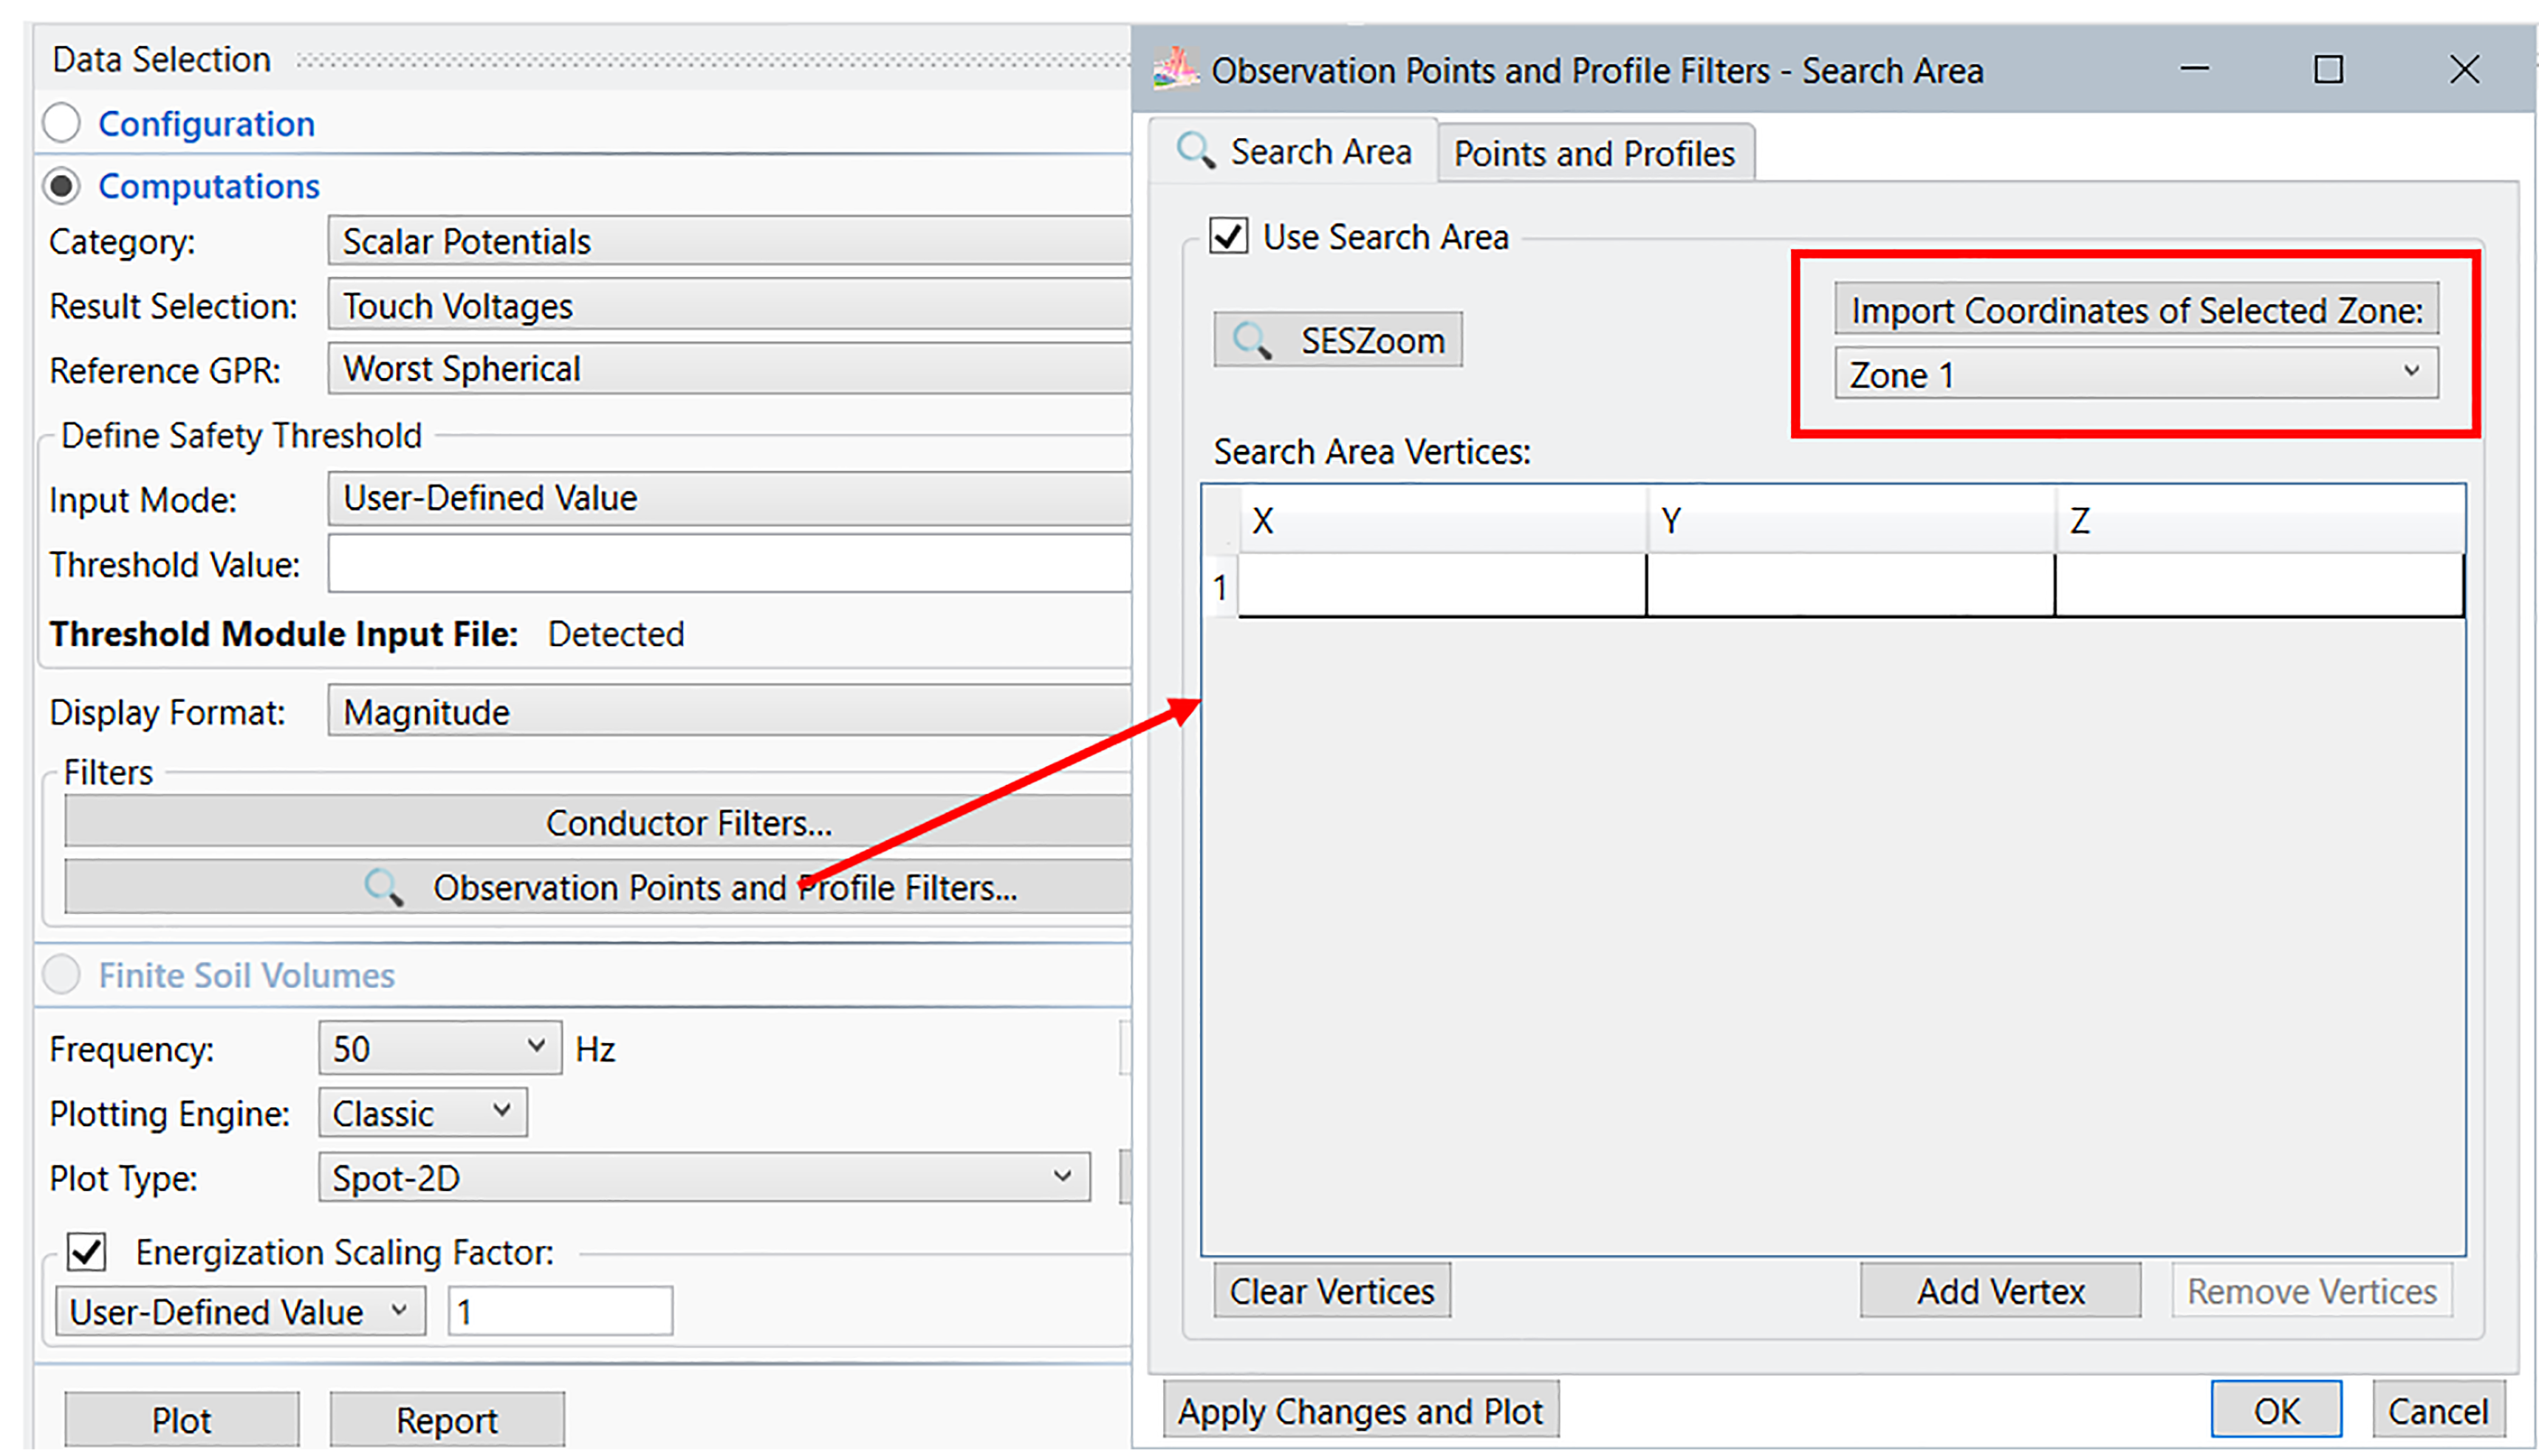
It is now possible to import coordinates of a selected zone specified in the Threshold module as a Search Area polygon for computation plots and reports. The option is available in both SESZoom and the Observation Points and Profile Filters screen as shown in the plot below. This feature allows analyzing each zone separately.
Figure 11: Importing coordinates of a selected zone in the Observation Points and Profile Filters screen.
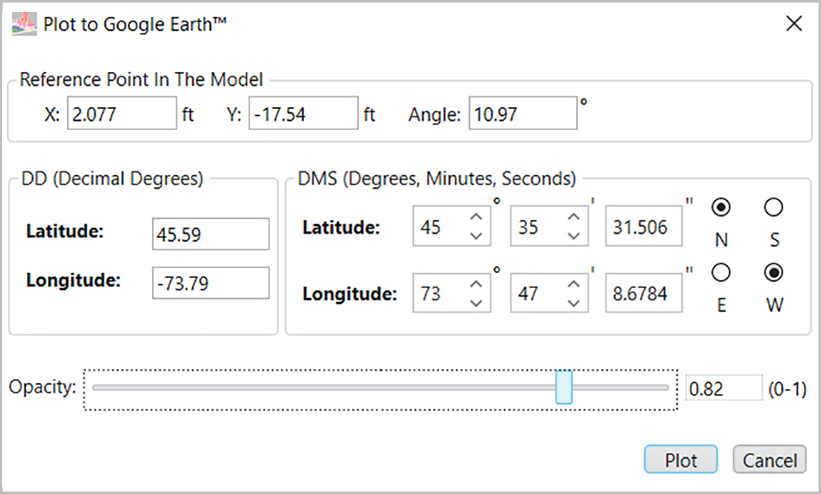
The Google EarthTM plot reference point window is far more flexible and now allows you to define
the reference latitude and longitude in degrees, minutes, seconds.
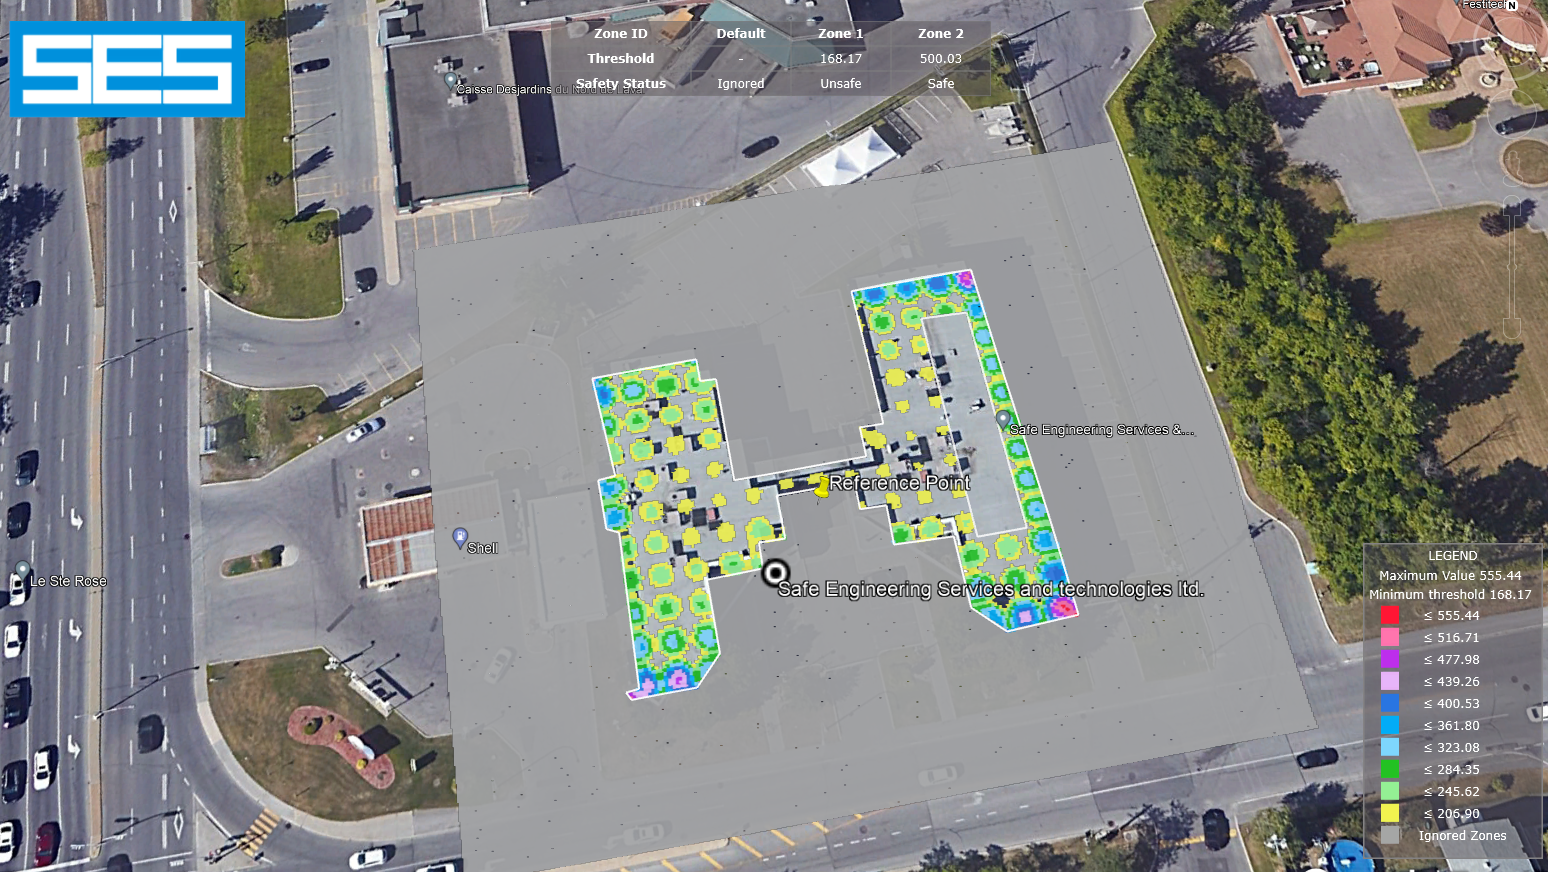
The Google EarthTM plot for touch and step voltages now includes not only the SESThreshold
zones but can also handle ignored zones.
SESPlotViewer
SESPlotEngine was developed mainly as a plotting framework to be used in an embedded fashion within other applications (e.g. SESResap, SESTransient, SESCurvefitDigitizer, etc.), restricted to only the subset of features that correspondingly apply in a given context. The standalone application SESPlotViewer exposes all its features, in an unrestricted way. Over the last year, it matured to become a convenient plotting package providing users with graphing and comparing abilities for tabulated data. The application was generally improved on many points, the most notable ones being as follows:
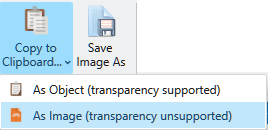
- The Copy to Clipboard button now expands to offer the choice of a transparent-capable graph, or not (see Figure 12). The transparent option is particularly useful for overlapping the graph on an existing image, e.g. to superpose it on another graph or to show results in context.
Figure 12: Choice to copy the graph with or without support for transparency.
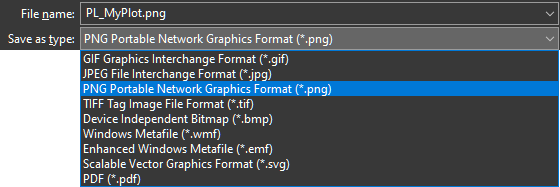
- The Save Image As method similarly offers a variety of different formats, some of which support transparency, such as .PNG (see Figure 13).
Figure 13: Variety of image formats available for saving graphs.
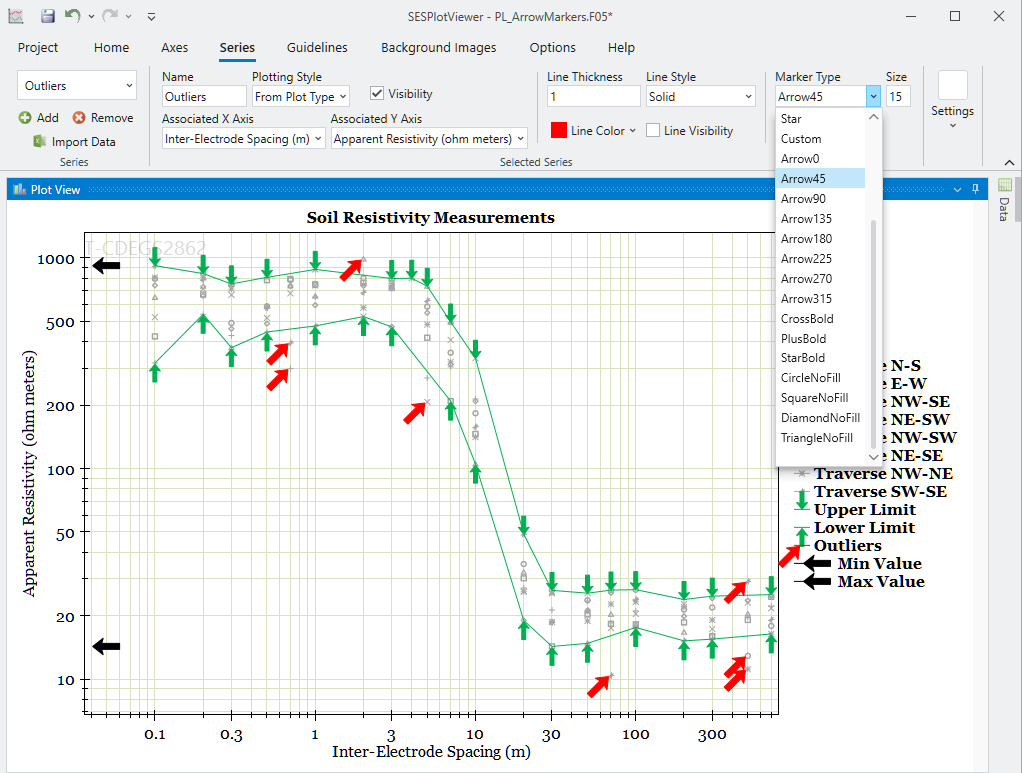
- The selection of marker types has been extended to include fill, no-fill and bold versions of a standard variety of shapes. Arrow markers were also introduced (see Figure 14). They are useful for emphasizing certain features of a graph, such as limits, outliers, position of peak values, etc.
Figure 14: Variety of marker types allow distinguishing
data series and highlighting graph features.
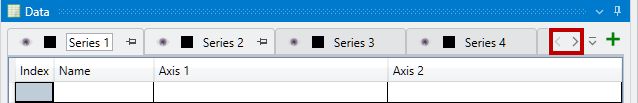
- It is now easier to manage data series tabs in the Data panel.
- Navigation arrows now allow scrolling to reveal any one of them that may be hidden (see Figure 15). Using the mouse wheel over the tabs has a similar effect.
Figure 15: Navigation arrows facilitate access to hidden data series tabs.
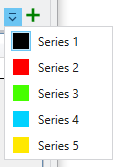
- The complete list of data series is accessible from a dropdown menu on the far right of the panel and allows making a selection (see Figure 16).
Figure 16: Vertical list of data series.
- Tabs can be reordered by click-and-dragging them at a desired positions. An option
also allows to pin (
 ) them, which keeps them first in the list. ) them, which keeps them first in the list.
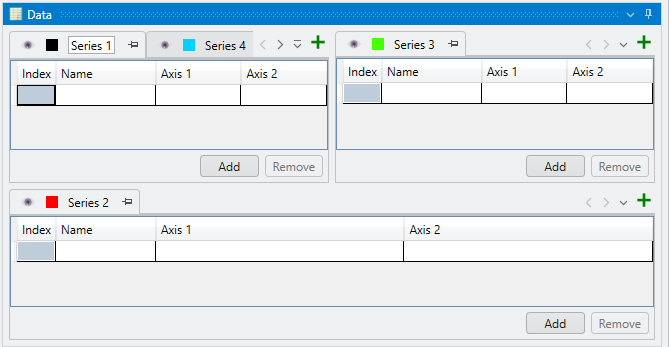
- Data series tab groups can be created and stacked side-by-side for easier comparison. Figure 17 shows an example of a now possible layout.
Figure 17: Stacking of data series tabs.
It is to be noted that the relevant parts of these new features accordingly propagate to other
applications where SESPlotEngine is embedded.
|