|
||
Improvements in SESTransientSESTransient received several improvements during the past year, covering study definition, computation feedback, post-processing performance, and result visualization. Graphical selection has been extended to observation points and profiles. Users can select, inspect, and manage observation points directly in the 3D Network Viewer. Detailed editing of profile and conductor selections is also easier to access from the main selection interface. SESTransient now supports HIFREQ models containing finite volumes and in addition, lightning strike locations are displayed directly in the Network Viewer, giving users an immediate visual check that the energization point is applied to the intended part of the system. 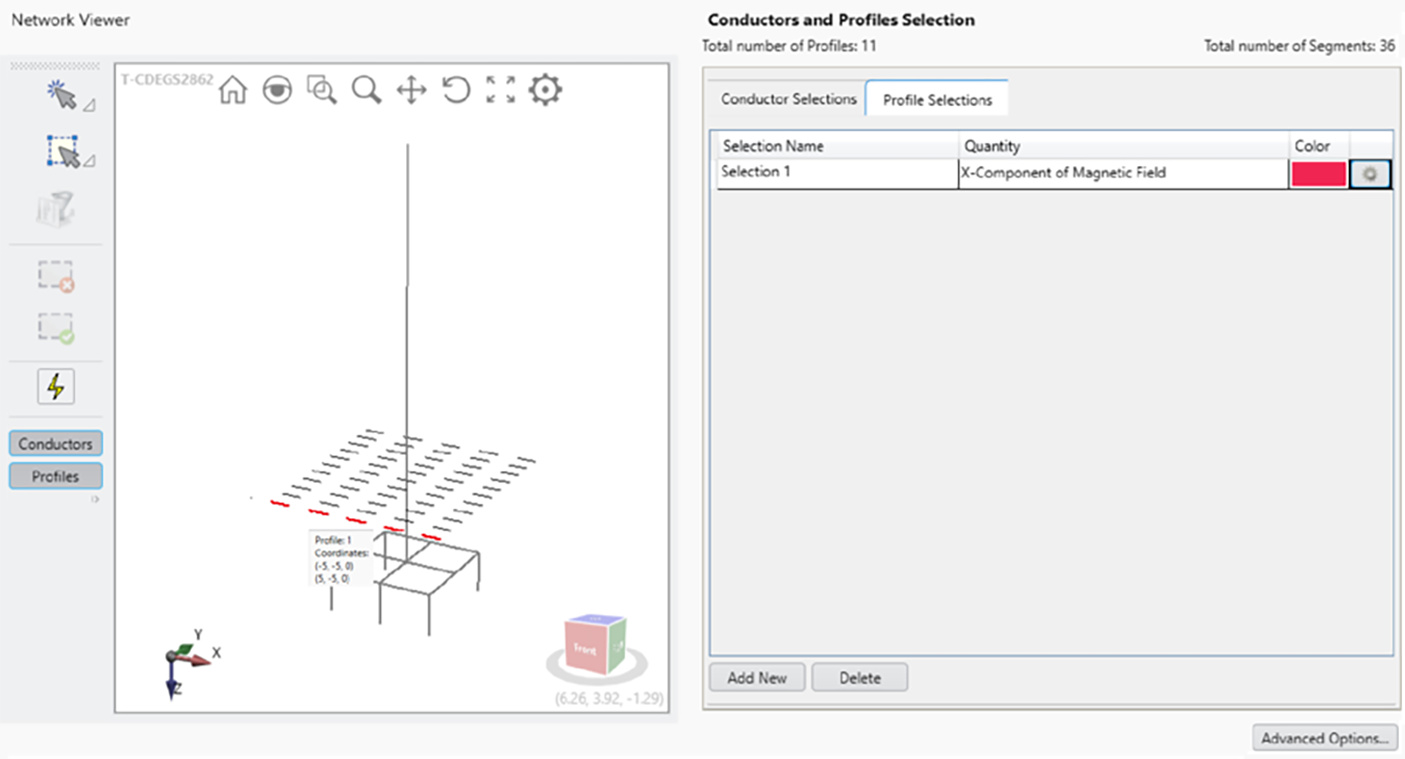
Graphical selection of observation points and profiles. 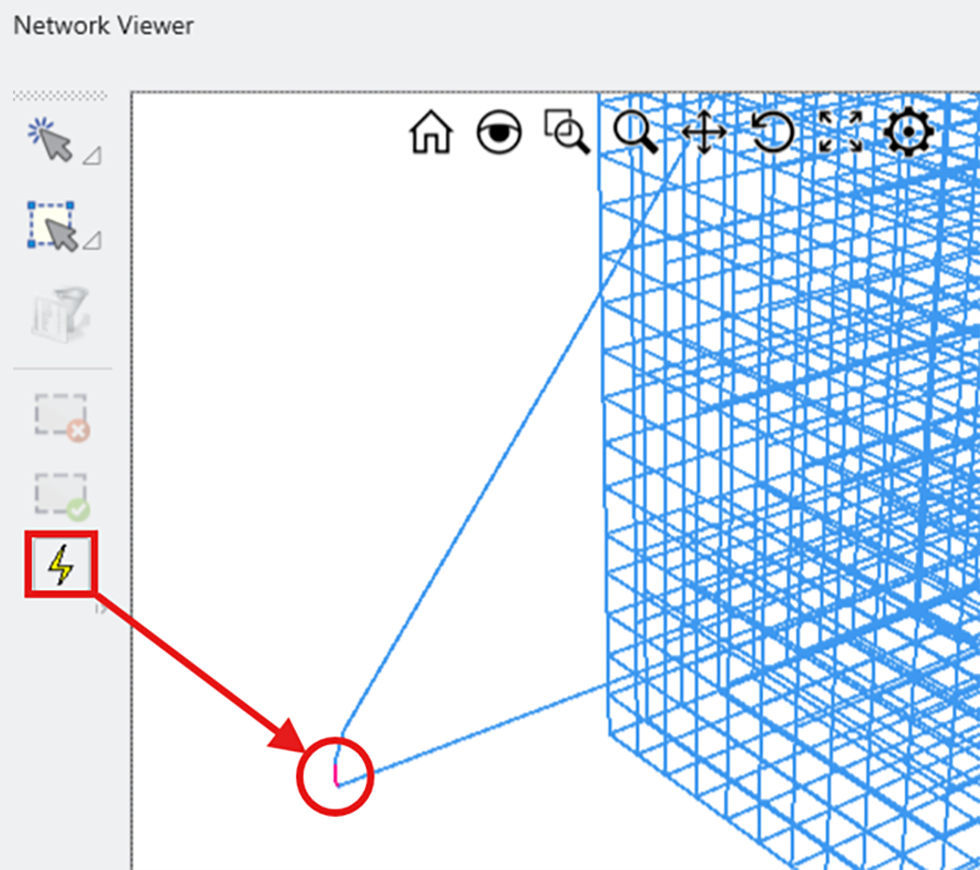
Visualization of the energization location in the Network Viewer. Time-domain step-voltage post-processing has been significantly optimized. In a representative 100 m x 100 m surface with 1 m spacing, a calculation that previously required more than two hours was completed in less than one minute in version 21.0. An estimated cycle time is reported directly in the Computation view, based on the time required to complete one HIFREQ run during the first cycle and on the number of HIFREQ runs executed in parallel, giving users a better indication of how long the current computation cycle is expected to take, especially for studies involving many frequencies and several parallel processes. 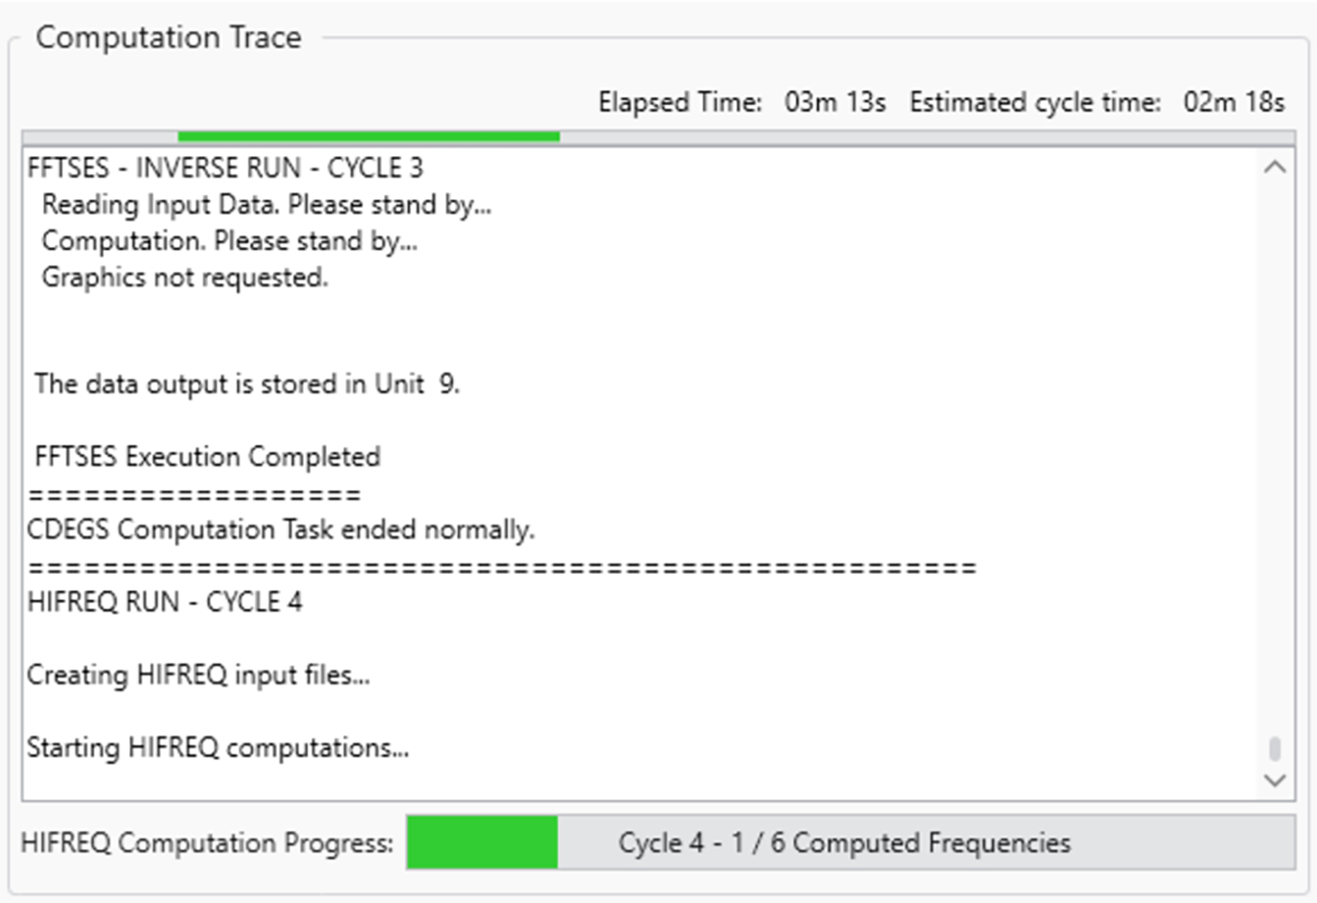
Cycle-time estimate displayed during computation. The presentation of transient results is modernized through the integration of SESResultsViewer and SESGallery directly in SESTransient. Three-dimensional plots and animations are visualized through SESResultsViewer, which is familiar to CDEGS users and is intended to eventually replace the older FFT21Data animation tool. 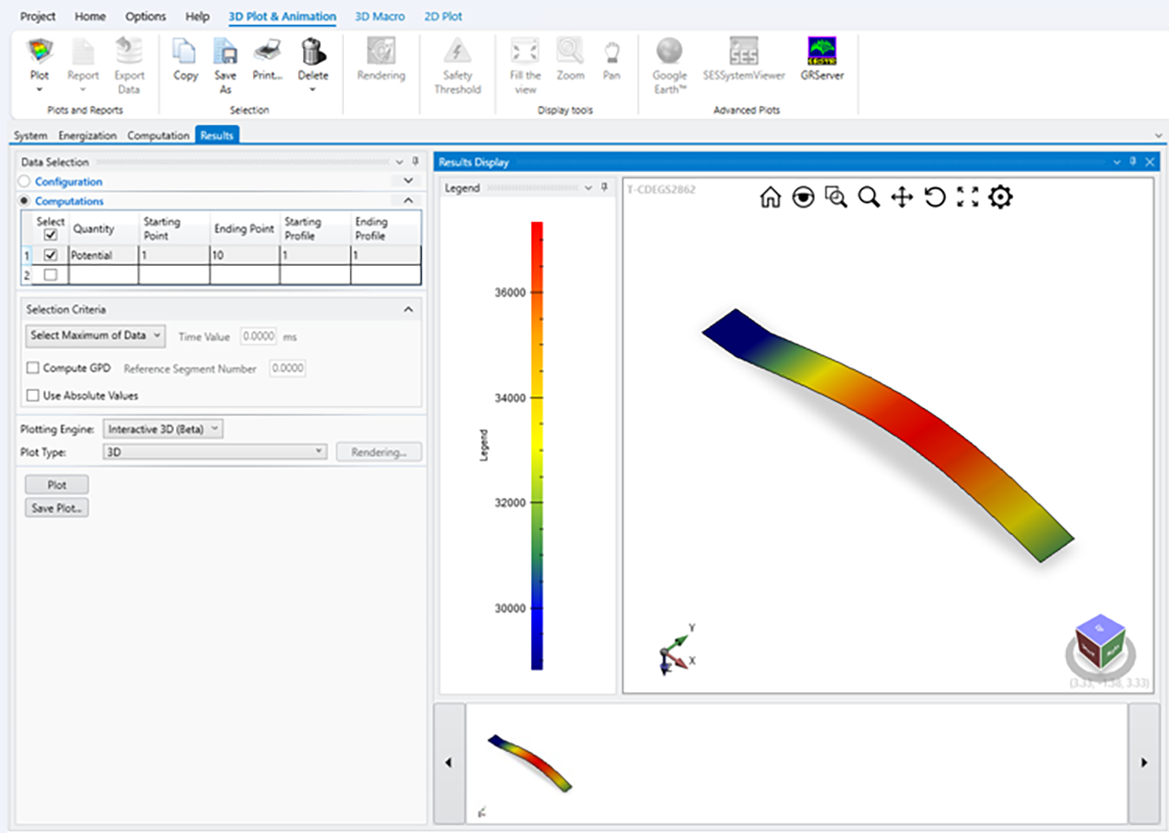
SESResultsViewer embedded in SESTransient for 3D plots and animations. 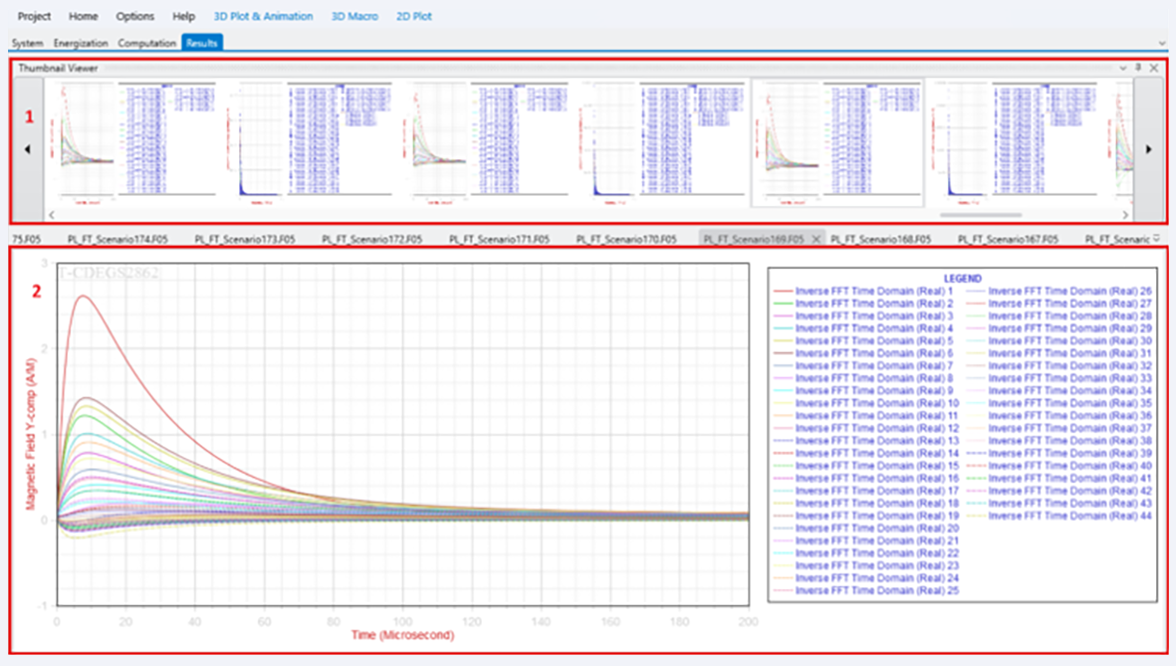
SESGallery in SESTransient. See the article entitled “SESTransient Improvements” in these Proceedings for further details. |
||
|
||
|
SES & technologies ltd. 3055 Blvd. des Oiseaux, Laval, Quebec, Canada, H7L 6E8 +1 (450) 622-5000 info@sestech.com ©2026 SafEngServices & technologies ltd. |